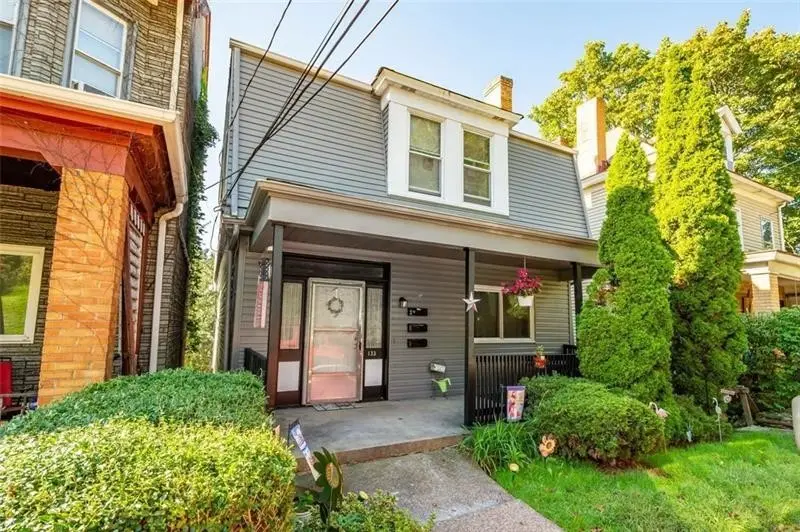
133 Glenmore Ave
West View, PA 15229
$280,000B+
3 bd · 3.0 ba ·
1,668 sqft ·
Built 1930
· MultiFamily
· Active
· 121 DOM
Cashflow @ list (25.0% down · 7.5%)
Estimated rent
$3,507/mo
Mortgage (P&I)
−$1,468
Tax + insurance
−$384
HOA
−$0
Vac / Maint / Mgmt
−$736
Net cashflow
$918/mo
Annual
$11,019/yr
Cap rate
10.23%
Cash-on-cash
14.05%
DSCR
1.63
1% rule
1.25%
Cash to close
$78,400
Investor read
- This is a 2×1bd/1ba + 1×2bd/1ba units multifamily listed at $280k.
- At list price, monthly cash flow is $918 ($11k/yr) — positive. Per door: $306/mo.
- The deal already cash-flows at list — no discount required.
- Meets the 1% rule at list price ($4k rent vs $280k).
- It's been on market 121 days — a 12% lower offer ($246k) is reasonable based on typical stale-listing flexibility.
- Recommended offer: $246k (12.0% below list) — sets the bar for market timing.
- Local home prices are declining (-3.0%/yr); year-one equity from $2k of loan paydown is wiped out by about $8k of value loss. Plan a longer hold.
- Location reads 92/100 on livability (#8 in PA, #32 nationally) — a professional / high-income tenant draw. Strengths: crime A+, amenities A+, commute A+.
- North Hills SD (suburban): math 48% / reading 72% proficiency, ranked #70 of 539 in PA (top 13%) — acceptable for families but not a draw, mixed tenant base, ~2y average lease; only 20% free/reduced lunch — higher-income household profile.
- Watch-outs: built in 1930 — expect roof / HVAC / electrical / plumbing capex.
- Market conditions: Rents rising (+2.7%/yr); 41 active listings in the ZIP; 8 comparable units currently listed for rent nearby; rentals at typical pace (median 15d on market — plan ~3-4 weeks tenant-placement turnaround); solid renter incomes; 2,996 units permitted in Allegheny County in 2024 (1,588 in 5+ unit buildings).
- 4 sale attempts since 13y ago; this cycle's ask has dropped $20k (7%) from the opening price — seller is motivated, your offer sets the floor, not the list.
- At projected returns (-3.0% appreciation + 2.7% rent growth), your $78k cash investment doubles in ~9 years — after that, you're playing with house money.
- Cap rate 10.2% vs local median 3.8% in West View — top-decile yield for the area; either an underpriced asset or a hidden risk that comps aren't pricing in. Stress-test before assuming the spread holds.
- At $3,507/mo this rent would consume 46% of the median local household income ($91k/yr) (locally 261% of renters already pay >50% of income on rent) — very limited rent-growth headroom before tenants either downsize or default.
Questions for listing agent
- It's been on market 121 days. Have you received any prior offers? Is the seller open to a 12% concession, seller financing, or rate buy-down credit?
- Can we see the unit-by-unit rent roll, current vacancy, and any below-market leases? What's the average tenancy length?
- What capital expenditures (roof, boiler, parking lot, exteriors) have been made in the last 5 years, and what's planned in the next 2?
- Built in 1930 — when were the roof, HVAC, electrical panel, plumbing, and water heater last replaced?
- Why hasn't it sold? Are there any deal-killer items the seller is aware of (foundation, flood, title, zoning, code violations)?
- Is there a deadline driving the sale (1031 exchange, divorce, estate, relocation)? That informs how much negotiation room exists.
- Schools are B-rated — typically a magnet for longer-tenancy family renters. What's the average tenant stay here, and is there a school-zone premium baked into asking?
- What's the average days-on-market for RENTAL listings here right now (not sales)? A rising rental-DOM trend means longer vacancies and softer asking-rent achievability than the comps imply.
CashFlowRE · CFR-04BXY4DC5JJSFJ
· Data 2 days ago
cashflowre.app · 2026-05-29