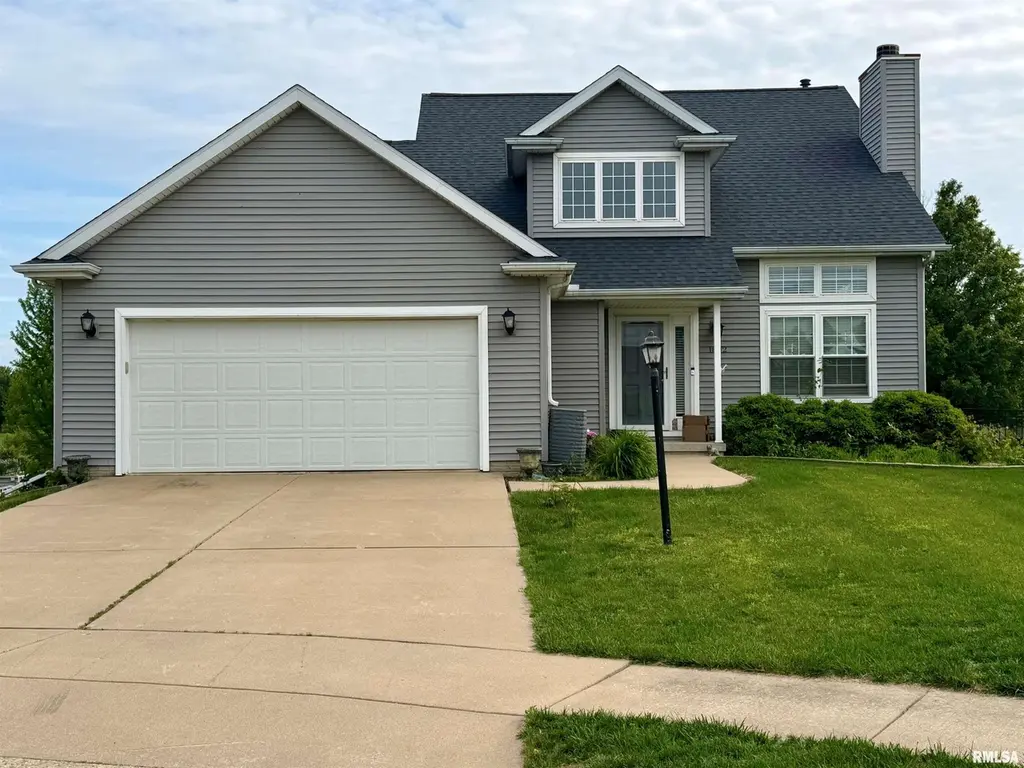
1802 Prairie Ct
Peoria, IL 61525
$399,000F
3 bd · 2.5 ba ·
1,781 sqft ·
Built 2002
· SingleFamily
· Coming Soon
· 29 DOM
Cashflow @ list (25.0% down · 7.5%)
Estimated rent
$1,597/mo
Mortgage (P&I)
−$2,092
Tax + insurance
−$725
HOA
−$0
Vac / Maint / Mgmt
−$335
Net cashflow
$-1,557/mo
Annual
$-18,678/yr
Cap rate
1.61%
Cash-on-cash
-16.72%
DSCR
0.26
1% rule
0.40%
Cash to close
$111,720
Investor read
- This is a 3-bed/2.5-bath single-family listed at $399k.
- At list price, monthly cash flow is $-2k ($-19k/yr) — negative.
- To cash-flow at today's rent, offer at most $134k (66.4% below list).
- To meet the 1% rule (rent ≥ 1% of price), the offer needs to be $160k (60.0% below list).
- It's been on market 29 days — a 2% lower offer ($393k) is reasonable based on typical stale-listing flexibility.
- Recommended offer: $134k (66.4% below list) — sets the bar for cash-flow.
- Local home prices are declining (-3.0%/yr); year-one equity from $3k of loan paydown is wiped out by about $12k of value loss. Plan a longer hold.
- Location reads 73/100 on livability (#270 in IL) — a middle-class / working-renter tenant base. Strengths: commute A+, cost of living A+, housing A+; Watch: employment D+, crime F.
- Dunlap CUSD 323 (rural): math 57% / reading 61% proficiency, ranked #28 of 620 in IL (top 4%) — acceptable for families but not a draw, mixed tenant base, ~2y average lease; only 10% free/reduced lunch — higher-income household profile.
- Zoned schools: Banner Elementary School (math 52% / reading 47%, grade D, #182 of 2,056 statewide, top 10%, 381 students, 0% FRL); Dunlap High School (math 60% / reading 53%, grade C, #24 of 693 statewide, top 3%, 1,375 students, 0% FRL).
- Market conditions: 76 active listings in the ZIP; 73 units permitted in Peoria County in 2024 (0 in 5+ unit buildings).
- Peoria County population projected at -11% by 2050 — secular population decline; favor cash flow + early exit over multi-decade hold.
- 2 sale attempts since 4y ago; this cycle's ask is 14% above the opening price — seller raised mid-cycle; expect resistance to lowballs.
- Cap rate 1.6% vs local median 5.6% in Peoria — below-typical yield; the buyer is paying a premium for something (appreciation thesis, condition, location) that the cap rate doesn't capture.
Questions for listing agent
- What do current leases actually rent for vs. the listed asking? Can we see a recent rent roll and the last 12 months of T-12 income?
- Is there a deadline driving the sale (1031 exchange, divorce, estate, relocation)? That informs how much negotiation room exists.
- Schools are F-rated, which usually means shorter tenancies and higher turnover. Who's the typical renter profile here, and what's been the actual vacancy rate?
- Crime grade is F in this area — have there been break-ins, vandalism, or insurance claims at this property in the last 3 years? What carrier currently insures it and at what premium?
- The area grade is low — what's the realistic commute time and amenity access for the typical tenant pool here? Any planned neighborhood developments (good or bad) we should know about?
- What's the average days-on-market for RENTAL listings here right now (not sales)? A rising rental-DOM trend means longer vacancies and softer asking-rent achievability than the comps imply.
- What's the recent tenant-quality profile in this submarket — average credit score on applications, eviction rate, late-payment / NSF rate, and stable-employment percentage? A property-management company in the area should have these aggregated.
- How much new for-sale + rental construction is in the pipeline within 1–3 miles? Heavy new supply typically softens prices + rents 12–24 months out; constrained supply supports both.
CashFlowRE · CFR-05D8GC0CMYAMN2
· Data 23 h ago
cashflowre.app · 2026-05-29