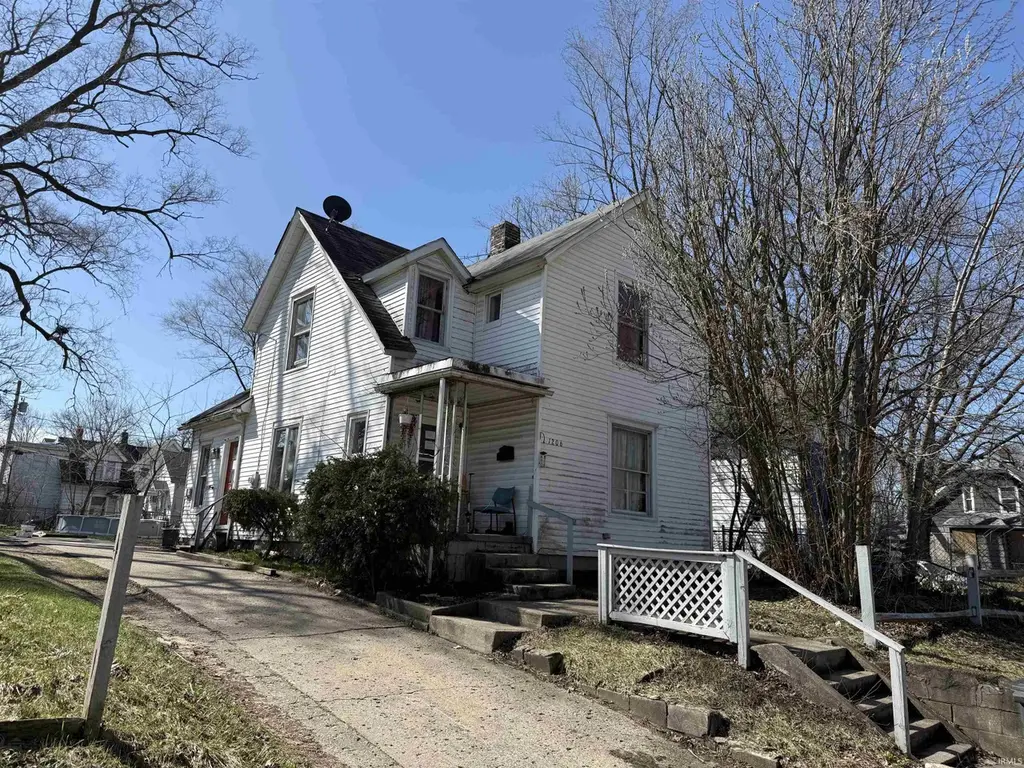
1206 E Indiana Ave
South Bend, IN 46613
$105,000B+
4 bd · 2.0 ba ·
1,860 sqft ·
Built 1927
· MultiFamily
· Active
· 85 DOM
Cashflow @ list (25.0% down · 7.5%)
Estimated rent
$3,233/mo
Mortgage (P&I)
−$551
Tax + insurance
−$130
HOA
−$0
Vac / Maint / Mgmt
−$679
Net cashflow
$1,874/mo
Annual
$22,483/yr
Cap rate
27.71%
Cash-on-cash
76.47%
DSCR
4.40
1% rule
3.08%
Cash to close
$29,400
Investor read
- This is a 4-bed/2.0-bath multifamily listed at $105k.
- At list price, monthly cash flow is $2k ($22k/yr) — positive.
- The deal already cash-flows at list — no discount required.
- Meets the 1% rule at list price ($3k rent vs $105k).
- It's been on market 85 days — a 6% lower offer ($99k) is reasonable based on typical stale-listing flexibility.
- Recommended offer: $99k (6.0% below list) — sets the bar for market timing.
- Local home prices are declining (-3.0%/yr); year-one equity from $726 of loan paydown is wiped out by about $3k of value loss. Plan a longer hold.
- Location reads 64/100 on livability (#365 in IN) — a middle-class / working-renter tenant base. Strengths: cost of living A+, housing A+, health & safety A+; Watch: amenities D, employment D, schools F.
- South Bend Community School Corporation (urban): math 12% / reading 21% proficiency, ranked #284 of 301 in IN (top 94%) — low school quality limits family demand, transient renter base, plan for 1-2y turnover; 66% free/reduced lunch — lower-income household profile, screen leases tightly.
- Watch-outs: built in 1927 — expect roof / HVAC / electrical / plumbing capex.
- Market conditions: Rents rising fast (+4.1%/yr); 77 active listings in the ZIP; 13 comparable units currently listed for rent nearby; rentals lingering (median 44d on market — plan ~5-8 weeks vacancy on turnover, expect pricing pressure); 54% of comp listings sitting > 30 days — soft ceiling on asking rent; lower-income renter base — watch delinquency; 754 units permitted in St. Joseph County in 2024 (460 in 5+ unit buildings).
- At projected returns (-3.0% appreciation + 4.1% rent growth), your $29k cash investment doubles in ~2 years — after that, you're playing with house money.
- Cap rate 27.7% vs local median 4.4% in South Bend — top-decile yield for the area; either an underpriced asset or a hidden risk that comps aren't pricing in. Stress-test before assuming the spread holds.
- At $3,233/mo this rent would consume 91% of the median local household income ($43k/yr) (locally 545% of renters already pay >50% of income on rent) — very limited rent-growth headroom before tenants either downsize or default.
Questions for listing agent
- It's been on market 85 days. Have you received any prior offers? Is the seller open to a 6% concession, seller financing, or rate buy-down credit?
- Built in 1927 — when were the roof, HVAC, electrical panel, plumbing, and water heater last replaced?
- Why hasn't it sold? Are there any deal-killer items the seller is aware of (foundation, flood, title, zoning, code violations)?
- Is there a deadline driving the sale (1031 exchange, divorce, estate, relocation)? That informs how much negotiation room exists.
- Schools are F-rated, which usually means shorter tenancies and higher turnover. Who's the typical renter profile here, and what's been the actual vacancy rate?
- Crime grade is F in this area — have there been break-ins, vandalism, or insurance claims at this property in the last 3 years? What carrier currently insures it and at what premium?
- What's the average days-on-market for RENTAL listings here right now (not sales)? A rising rental-DOM trend means longer vacancies and softer asking-rent achievability than the comps imply.
- What's the recent tenant-quality profile in this submarket — average credit score on applications, eviction rate, late-payment / NSF rate, and stable-employment percentage? A property-management company in the area should have these aggregated.
CashFlowRE · CFR-06J11EBQ7ADDHC
· Data 2 days ago
cashflowre.app · 2026-05-29