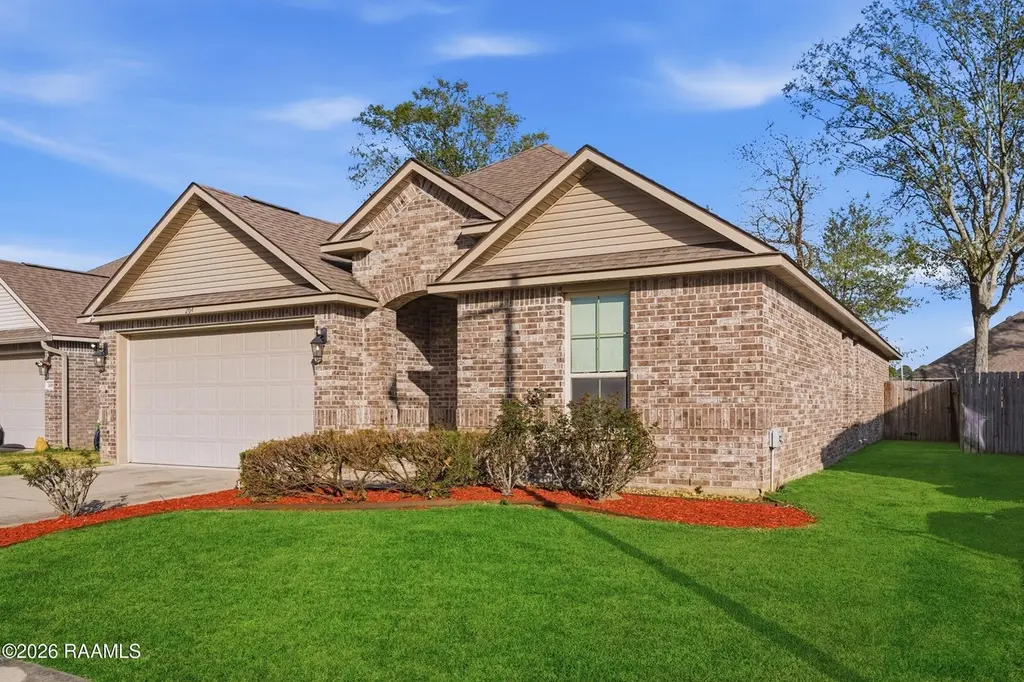
204 Bridle Way
Carencro, LA 70507
$224,900D+
4 bd · 2.0 ba ·
2,110 sqft ·
Built 2017
· SingleFamily
· Active
· 152 DOM
Cashflow @ list (25.0% down · 7.5%)
Estimated rent
$1,974/mo
Mortgage (P&I)
−$1,179
Tax + insurance
−$247
HOA
−$25
Vac / Maint / Mgmt
−$415
Net cashflow
$109/mo
Annual
$1,304/yr
Cap rate
6.87%
Cash-on-cash
2.07%
DSCR
1.09
1% rule
0.88%
Cash to close
$62,972
Investor read
- This is a 4-bed/2.0-bath single-family listed at $225k.
- At list price, monthly cash flow is $109 ($1k/yr) — positive.
- The deal already cash-flows at list — no discount required.
- To meet the 1% rule (rent ≥ 1% of price), the offer needs to be $197k (12.2% below list).
- It's been on market 152 days — a 12% lower offer ($198k) is reasonable based on typical stale-listing flexibility.
- Recommended offer: $197k (12.2% below list) — sets the bar for 1% rule.
- Local home prices are declining (-3.0%/yr); year-one equity from $2k of loan paydown is wiped out by about $7k of value loss. Plan a longer hold.
- Location reads 69/100 on livability (#65 in LA) — a middle-class / working-renter tenant base. Strengths: cost of living A+, housing A+, health & safety A+; Watch: schools C-, employment C-, crime D.
- Lafayette Parish (urban): math 38% / reading 46% proficiency, ranked #19 of 98 in LA (top 19%) — families likely to look elsewhere, expect single-tenant / working-renter base with shorter leases.
- Market conditions: 324 active listings in the ZIP; 4 comparable units currently listed for rent nearby; rentals lingering (median 44d on market — plan ~5-8 weeks vacancy on turnover, expect pricing pressure); 50% of comp listings sitting > 30 days — soft ceiling on asking rent; 1,585 units permitted in Lafayette Parish in 2024 (10 in 5+ unit buildings).
- Lafayette County population projected at +34% by 2050 — long-run rental-demand tailwind backs the buy-and-hold thesis.
- 6 sale attempts since 10y ago; this cycle's ask has dropped $14k (6%) from the opening price — seller is motivated, your offer sets the floor, not the list.
- Climate carrying-cost: severe wind risk, 99% chance of damaging wind over 30y; extreme-heat days projected 7→20/yr by 2055 (HVAC capex compounding) — expect insurance premiums to compound above CPI over the hold.
- Cap rate 6.9% vs local median 5.3% in Carencro — meaningfully above typical; check what's discounted (condition, days-on-market, listing class) to confirm the premium yield is real.
- This rent runs 37% of the median local income ($64k/yr) — at the standard rent-burdened threshold; future hikes will face affordability resistance.
Questions for listing agent
- It's been on market 152 days. Have you received any prior offers? Is the seller open to a 12% concession, seller financing, or rate buy-down credit?
- What does the HOA fee cover, when was the last increase, and are there any pending special assessments or reserve-fund shortfalls?
- Why hasn't it sold? Are there any deal-killer items the seller is aware of (foundation, flood, title, zoning, code violations)?
- Is there a deadline driving the sale (1031 exchange, divorce, estate, relocation)? That informs how much negotiation room exists.
- Crime grade is D in this area — have there been break-ins, vandalism, or insurance claims at this property in the last 3 years? What carrier currently insures it and at what premium?
- The area grade is low — what's the realistic commute time and amenity access for the typical tenant pool here? Any planned neighborhood developments (good or bad) we should know about?
- What's the average days-on-market for RENTAL listings here right now (not sales)? A rising rental-DOM trend means longer vacancies and softer asking-rent achievability than the comps imply.
- What's the recent tenant-quality profile in this submarket — average credit score on applications, eviction rate, late-payment / NSF rate, and stable-employment percentage? A property-management company in the area should have these aggregated.
CashFlowRE · CFR-080KTFCY7K72J9
· Data 2 days ago
cashflowre.app · 2026-05-29