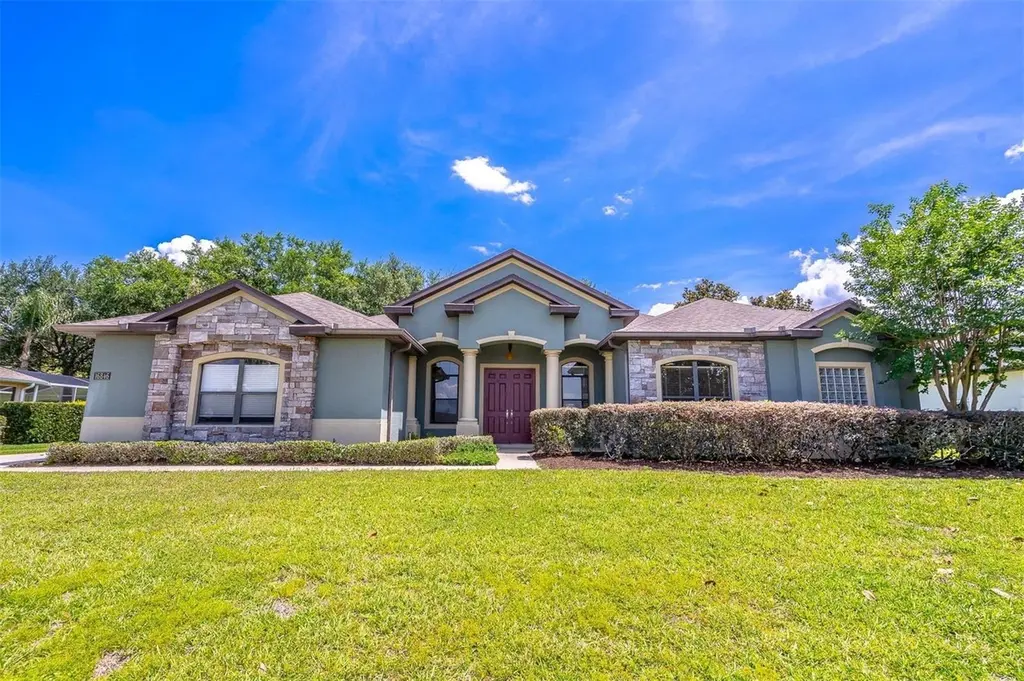
16846 Florence View Dr
Montverde, FL 34756
$575,000C+
4 bd · 3.0 ba ·
2,972 sqft ·
Built 2005
· SingleFamily
· Pending
· 4 DOM
Cashflow @ list (25.0% down · 7.5%)
Estimated rent
$5,906/mo
Mortgage (P&I)
−$3,015
Tax + insurance
−$891
HOA
−$50
Vac / Maint / Mgmt
−$1,240
Net cashflow
$709/mo
Annual
$8,508/yr
Cap rate
7.77%
Cash-on-cash
5.28%
DSCR
1.24
1% rule
1.03%
Cash to close
$161,000
Investor read
- This is a 4-bed/3.0-bath single-family listed at $575k.
- At list price, monthly cash flow is $709 ($9k/yr) — positive.
- The deal already cash-flows at list — no discount required.
- Meets the 1% rule at list price ($6k rent vs $575k).
- Only 4 days on market — expect competitive offers; lowballing is unlikely to land.
- Local home prices are declining (-3.0%/yr); year-one equity from $4k of loan paydown is wiped out by about $17k of value loss. Plan a longer hold.
- Location reads 66/100 on livability (#598 in FL) — a middle-class / working-renter tenant base. Strengths: crime A+, employment A+, housing A+; Watch: cost of living D, amenities F, commute F.
- Lake (suburban): math 49% / reading 50% proficiency, ranked #37 of 73 in FL (top 51%) — families likely to look elsewhere, expect single-tenant / working-renter base with shorter leases.
- Zoned schools: Grassy Lake Elementary School (math 58% / reading 63%, grade B-, #664 of 2,144 statewide, top 32%, 1,209 students, 29% FRL); East Ridge Middle School (math 62% / reading 59%, grade B+, #131 of 571 statewide, top 23%, 1,182 students, 29% FRL); Lake Minneola High School (math 44% / reading 57%, grade D+, #171 of 667 statewide, top 26%, 2,176 students, 28% FRL) — zoned schools average 29% FRL vs 49% district-wide (20 pts lower); this property's tenant base skews higher-income than the district average.
- Market conditions: 204 active listings in the ZIP; 3 comparable units currently listed for rent nearby; rentals at typical pace (median 26d on market — plan ~3-4 weeks tenant-placement turnaround); solid renter incomes; 4,799 units permitted in Lake County in 2024 (814 in 5+ unit buildings).
- Lake County population projected at +37% by 2050 — long-run rental-demand tailwind backs the buy-and-hold thesis.
- 10 sale attempts since 21y ago with the ask held roughly flat each time — persistent listings suggest the price (not the market) is what's stuck; bring a comps-based counter.
- Current owner paid $490k; 17% above their basis — modest negotiation headroom, anchor on the comps not their cost.
- Climate carrying-cost: severe wind risk, 99% chance of damaging wind over 30y; extreme-heat days projected 7→24/yr by 2055 (HVAC capex compounding) — expect insurance premiums to compound above CPI over the hold.
- Cap rate 7.8% vs local median 2.3% in Montverde — top-decile yield for the area; either an underpriced asset or a hidden risk that comps aren't pricing in. Stress-test before assuming the spread holds.
- At $5,906/mo this rent would consume 65% of the median local household income ($108k/yr) (locally 24% of renters already pay >50% of income on rent) — very limited rent-growth headroom before tenants either downsize or default.
Questions for listing agent
- What does the HOA fee cover, when was the last increase, and are there any pending special assessments or reserve-fund shortfalls?
- Is there a deadline driving the sale (1031 exchange, divorce, estate, relocation)? That informs how much negotiation room exists.
- What's the average days-on-market for RENTAL listings here right now (not sales)? A rising rental-DOM trend means longer vacancies and softer asking-rent achievability than the comps imply.
- What's the recent tenant-quality profile in this submarket — average credit score on applications, eviction rate, late-payment / NSF rate, and stable-employment percentage? A property-management company in the area should have these aggregated.
- How much new for-sale + rental construction is in the pipeline within 1–3 miles? Heavy new supply typically softens prices + rents 12–24 months out; constrained supply supports both.
CashFlowRE · CFR-08DE9K433MT664
· Data 4 weeks ago
cashflowre.app · 2026-05-29