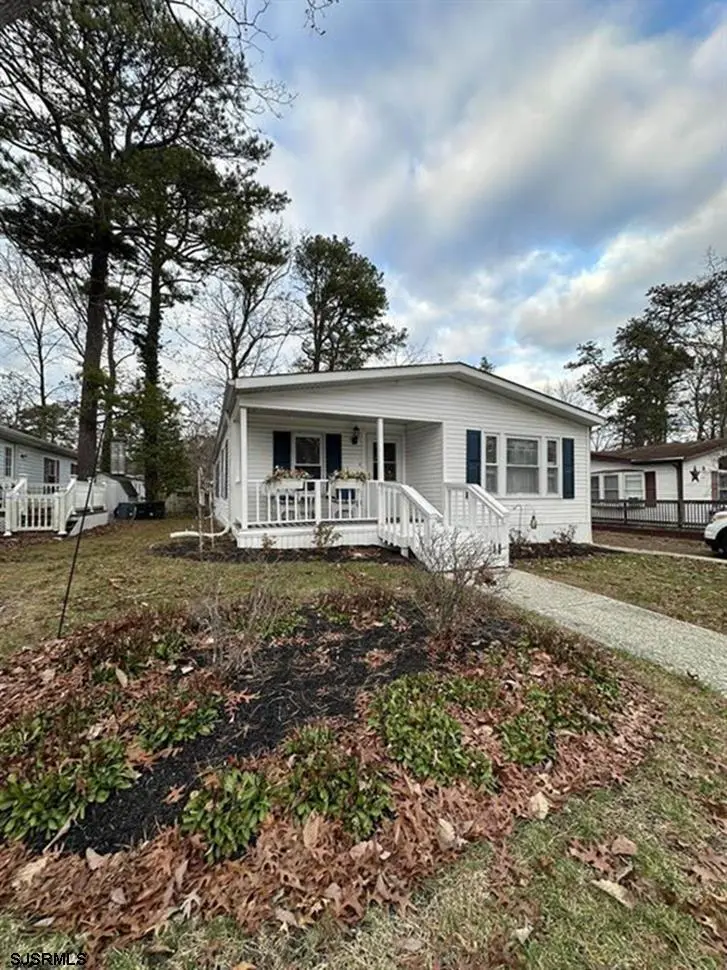
3 Hickory Ln Ln
Estell Manor, NJ 08330
$175,000B
2 bd · 2.0 ba ·
1,375 sqft ·
Built 1987
· Manufactured
· Active
· 119 DOM
Cashflow @ list (25.0% down · 7.5%)
Estimated rent
$2,346/mo
Mortgage (P&I)
−$918
Tax + insurance
−$292
HOA
−$490
Vac / Maint / Mgmt
−$493
Net cashflow
$154/mo
Annual
$1,846/yr
Cap rate
7.35%
Cash-on-cash
3.77%
DSCR
1.17
1% rule
1.34%
Cash to close
$49,000
Investor read
- This is a 2-bed/2.0-bath manufactured listed at $175k.
- At list price, monthly cash flow is $154 ($2k/yr) — positive.
- The deal already cash-flows at list — no discount required.
- Meets the 1% rule at list price ($2k rent vs $175k).
- It's been on market 119 days — a 9% lower offer ($159k) is reasonable based on typical stale-listing flexibility.
- Recommended offer: $159k (9.0% below list) — sets the bar for market timing.
- In year one you build about $19k of equity ($1k loan paydown + $18k appreciation (10.0% local appreciation)).
- Location reads 64/100 on livability (#414 in NJ) — a middle-class / working-renter tenant base. Strengths: crime A+, employment A+, housing A+; Watch: schools C-, amenities F, commute F.
- Weymouth Township School District (rural): math 50% / reading 55% proficiency, ranked #351 of 612 in NJ (top 57%) — acceptable for families but not a draw, mixed tenant base, ~2y average lease.
- Watch-outs: HOA is 21% of rent.
- Market conditions: 240 active listings in the ZIP; solid renter incomes; 672 units permitted in Atlantic County in 2024 (258 in 5+ unit buildings).
- Atlantic County population projected at -12% by 2050 — secular population decline; favor cash flow + early exit over multi-decade hold.
- 3 sale attempts since 11y ago; this cycle's ask is 17% above the opening price — seller raised mid-cycle; expect resistance to lowballs.
- Current owner paid $43k; list at $175k implies a 307% gain — meaningful room to come down on a strong offer.
- At projected returns (10.0% appreciation + 3.0% rent growth), your $49k cash investment doubles in ~3 years — after that, you're playing with house money.
- By year 2, paydown + projected appreciation supports a ~$30k cash-out refi (75% LTV) — recoverable capital for the next deal without selling this one.
- Cap rate 7.3% vs local median 6.1% in Estell Manor — meaningfully above typical; check what's discounted (condition, days-on-market, listing class) to confirm the premium yield is real.
- This rent runs 36% of the median local income ($77k/yr) — at the standard rent-burdened threshold; future hikes will face affordability resistance.
Questions for listing agent
- It's been on market 119 days. Have you received any prior offers? Is the seller open to a 9% concession, seller financing, or rate buy-down credit?
- What does the HOA fee cover, when was the last increase, and are there any pending special assessments or reserve-fund shortfalls?
- Why hasn't it sold? Are there any deal-killer items the seller is aware of (foundation, flood, title, zoning, code violations)?
- Is there a deadline driving the sale (1031 exchange, divorce, estate, relocation)? That informs how much negotiation room exists.
- What's the average days-on-market for RENTAL listings here right now (not sales)? A rising rental-DOM trend means longer vacancies and softer asking-rent achievability than the comps imply.
- What's the recent tenant-quality profile in this submarket — average credit score on applications, eviction rate, late-payment / NSF rate, and stable-employment percentage? A property-management company in the area should have these aggregated.
- How much new for-sale + rental construction is in the pipeline within 1–3 miles? Heavy new supply typically softens prices + rents 12–24 months out; constrained supply supports both.
CashFlowRE · CFR-0A08VF44AX86KV
· Data 1 day ago
cashflowre.app · 2026-05-29