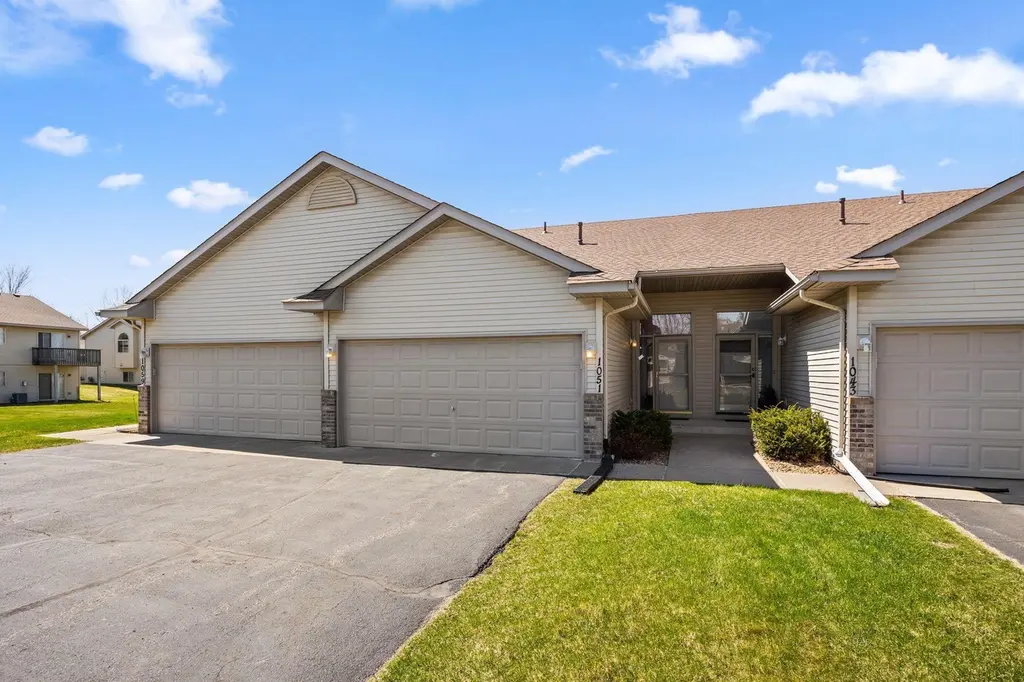
1051 Honeysuckle Ln SE
Cambridge, MN 55008
$229,000F
2 bd · 2.0 ba ·
931 sqft ·
Built 2002
· Townhouse
· Pending
· 26 DOM
Cashflow @ list (25.0% down · 7.5%)
Estimated rent
$1,219/mo
Mortgage (P&I)
−$1,201
Tax + insurance
−$327
HOA
−$285
Vac / Maint / Mgmt
−$256
Net cashflow
$-850/mo
Annual
$-10,204/yr
Cap rate
1.84%
Cash-on-cash
-15.91%
DSCR
0.29
1% rule
0.53%
Cash to close
$64,120
Investor read
- This is a 2-bed/2.0-bath townhouse listed at $229k.
- At list price, monthly cash flow is $-850 ($-10k/yr) — negative.
- To cash-flow at today's rent, offer at most $79k (65.6% below list).
- To meet the 1% rule (rent ≥ 1% of price), the offer needs to be $122k (46.8% below list).
- It's been on market 26 days — a 2% lower offer ($226k) is reasonable based on typical stale-listing flexibility.
- Recommended offer: $79k (65.6% below list) — sets the bar for cash-flow.
- Local home prices are declining (-3.0%/yr); year-one equity from $2k of loan paydown is wiped out by about $7k of value loss. Plan a longer hold.
- Location reads 75/100 on livability (#180 in MN, #3,872 nationally) — a middle-class / working-renter tenant base. Strengths: housing A+, health & safety A+, crime A; Watch: amenities F, commute F.
- Cambridge-Isanti Public School District (town): math 47% / reading 55% proficiency, ranked #96 of 301 in MN (top 32%) — acceptable for families but not a draw, mixed tenant base, ~2y average lease.
- Watch-outs: HOA is 23% of rent.
- Market conditions: 193 active listings in the ZIP; 6 comparable units currently listed for rent nearby; rentals at typical pace (median 24d on market — plan ~3-4 weeks tenant-placement turnaround); 191 units permitted in Isanti County in 2024 (28 in 5+ unit buildings).
- Isanti County population projected to shrink 9% by 2050 — rents likely to lag national; underwrite the cash flow, not the appreciation.
- 8 sale attempts since 24y ago with the ask held roughly flat each time — persistent listings suggest the price (not the market) is what's stuck; bring a comps-based counter.
- Current owner paid $165k; 39% above their basis — modest negotiation headroom, anchor on the comps not their cost.
- Cap rate 1.8% vs local median 3.0% in Cambridge — below-typical yield; the buyer is paying a premium for something (appreciation thesis, condition, location) that the cap rate doesn't capture.
Questions for listing agent
- What do current leases actually rent for vs. the listed asking? Can we see a recent rent roll and the last 12 months of T-12 income?
- What does the HOA fee cover, when was the last increase, and are there any pending special assessments or reserve-fund shortfalls?
- Is there a deadline driving the sale (1031 exchange, divorce, estate, relocation)? That informs how much negotiation room exists.
- The area grade is low — what's the realistic commute time and amenity access for the typical tenant pool here? Any planned neighborhood developments (good or bad) we should know about?
- What's the average days-on-market for RENTAL listings here right now (not sales)? A rising rental-DOM trend means longer vacancies and softer asking-rent achievability than the comps imply.
- What's the recent tenant-quality profile in this submarket — average credit score on applications, eviction rate, late-payment / NSF rate, and stable-employment percentage? A property-management company in the area should have these aggregated.
- How much new for-sale + rental construction is in the pipeline within 1–3 miles? Heavy new supply typically softens prices + rents 12–24 months out; constrained supply supports both.
CashFlowRE · CFR-0BF3HDCCWN9Q5K
· Data 3 weeks ago
cashflowre.app · 2026-05-29