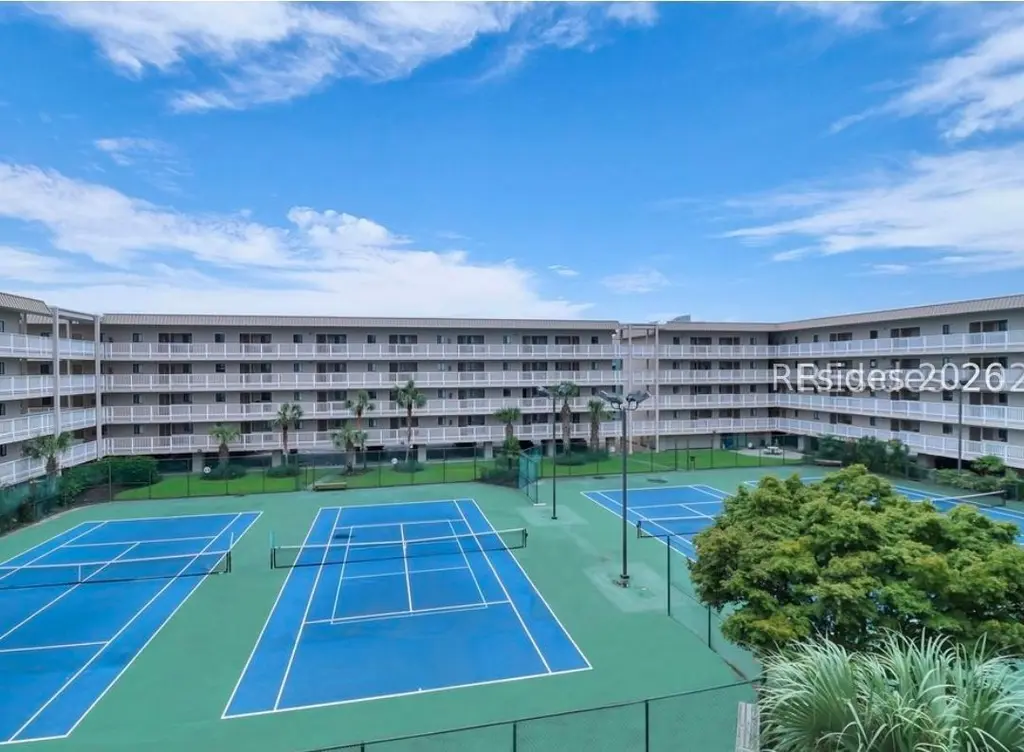
663 William Hilton Pkwy #2121
Hilton Head Island, SC 29928
$295,000D+
2 bd · 2.0 ba ·
843 sqft ·
Built 1982
· Condo
· Active
· 35 DOM
Cashflow @ list (25.0% down · 7.5%)
Estimated rent
$2,837/mo
Mortgage (P&I)
−$1,547
Tax + insurance
−$302
HOA
−$658
Vac / Maint / Mgmt
−$596
Net cashflow
$-266/mo
Annual
$-3,196/yr
Cap rate
5.21%
Cash-on-cash
-3.87%
DSCR
0.83
1% rule
0.96%
Cash to close
$82,600
Investor read
- This is a 2-bed/2.0-bath condo listed at $295k.
- At list price, monthly cash flow is $-266 ($-3k/yr) — negative.
- The deal already cash-flows at list — no discount required.
- To meet the 1% rule (rent ≥ 1% of price), the offer needs to be $284k (3.8% below list).
- It's been on market 35 days — a 3% lower offer ($286k) is reasonable based on typical stale-listing flexibility.
- Recommended offer: $284k (3.8% below list) — sets the bar for 1% rule.
- In year one you build about $12k of equity ($2k loan paydown + $9k appreciation (3.2% local appreciation)).
- Location reads 64/100 on livability (#157 in SC) — a middle-class / working-renter tenant base. Strengths: employment A+, crime A-; Watch: amenities F, commute F, cost of living F.
- Beaufort 01 (town): math 42% / reading 51% proficiency, ranked #17 of 80 in SC (top 21%) — families likely to look elsewhere, expect single-tenant / working-renter base with shorter leases.
- Watch-outs: HOA is 23% of rent.
- Market conditions: Rents rising (+3.2%/yr); 838 active listings in the ZIP; 4 comparable units currently listed for rent nearby; rentals lingering (median 44d on market — plan ~5-8 weeks vacancy on turnover, expect pricing pressure); 50% of comp listings sitting > 30 days — soft ceiling on asking rent; solid renter incomes; 1,824 units permitted in Beaufort County in 2024 (618 in 5+ unit buildings).
- Beaufort County population projected at +30% by 2050 — long-run rental-demand tailwind backs the buy-and-hold thesis.
- 12 sale attempts since 23y ago with the ask held roughly flat each time — persistent listings suggest the price (not the market) is what's stuck; bring a comps-based counter.
- Current owner paid $175k; list at $295k implies a 69% gain — meaningful room to come down on a strong offer.
- By year 4, paydown + projected appreciation supports a ~$39k cash-out refi (75% LTV) — recoverable capital for the next deal without selling this one.
- Cap rate 5.2% vs local median 3.0% in Hilton Head Island — top-decile yield for the area; either an underpriced asset or a hidden risk that comps aren't pricing in. Stress-test before assuming the spread holds.
- This rent runs 35% of the median local income ($98k/yr) — at the standard rent-burdened threshold; future hikes will face affordability resistance.
Questions for listing agent
- What do current leases actually rent for vs. the listed asking? Can we see a recent rent roll and the last 12 months of T-12 income?
- It's been on market 35 days. Have you received any prior offers? Is the seller open to a 4% concession, seller financing, or rate buy-down credit?
- What does the HOA fee cover, when was the last increase, and are there any pending special assessments or reserve-fund shortfalls?
- Any open or pending special assessments — roof, HVAC, plumbing, elevator, façade? What's the per-unit balance and payoff schedule, and is the seller paying it off at close or rolling it to the buyer?
- Is there a deadline driving the sale (1031 exchange, divorce, estate, relocation)? That informs how much negotiation room exists.
- Schools are B-rated — typically a magnet for longer-tenancy family renters. What's the average tenant stay here, and is there a school-zone premium baked into asking?
- The area grade is low — what's the realistic commute time and amenity access for the typical tenant pool here? Any planned neighborhood developments (good or bad) we should know about?
- What's the average days-on-market for RENTAL listings here right now (not sales)? A rising rental-DOM trend means longer vacancies and softer asking-rent achievability than the comps imply.
CashFlowRE · CFR-0BYD835PKSSXD2
· Data 2 days ago
cashflowre.app · 2026-05-29