117 S Hamilton St
Otterville, IL 62052
$169,000D
3 bd · 1.0 ba ·
1,380 sqft ·
Built 1963
· SingleFamily
· Pending
· 2 DOM
Cashflow @ list (25.0% down · 7.5%)
Estimated rent
$1,286/mo
Mortgage (P&I)
−$886
Tax + insurance
−$219
HOA
−$0
Vac / Maint / Mgmt
−$270
Net cashflow
$-89/mo
Annual
$-1,070/yr
Cap rate
5.66%
Cash-on-cash
-2.26%
DSCR
0.90
1% rule
0.76%
Cash to close
$47,320
Investor read
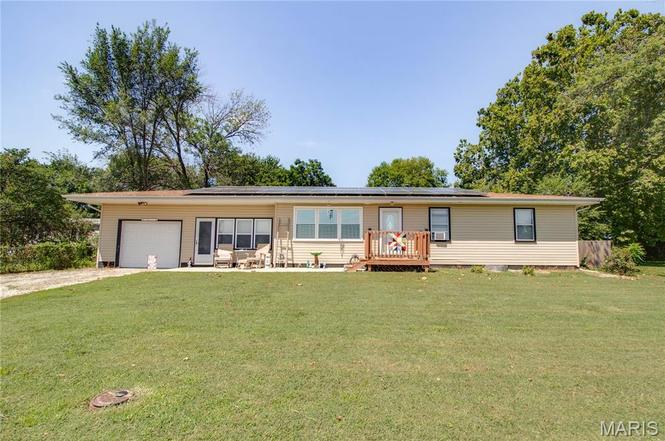
- This is a 3-bed/1.0-bath single-family listed at $169k.
- At list price, monthly cash flow is $-89 ($-1k/yr) — negative.
- To cash-flow at today's rent, offer at most $153k (9.3% below list).
- To meet the 1% rule (rent ≥ 1% of price), the offer needs to be $129k (23.9% below list).
- Only 2 days on market — expect competitive offers; lowballing is unlikely to land.
- Recommended offer: $129k (23.9% below list) — sets the bar for 1% rule.
- In year one you build about $18k of equity ($1k loan paydown + $17k appreciation (10.0% local appreciation)).
- Location reads 52/100 on livability (#1,319 in IL) — a working-class tenant base; expect higher turnover. Strengths: cost of living A+; Watch: housing C-, crime D-, amenities F.
- Jersey CUSD 100 (town): math 25% / reading 32% proficiency, ranked #260 of 620 in IL (top 42%) — low school quality limits family demand, transient renter base, plan for 1-2y turnover.
- Zoned schools: Jerseyville East Elem School (math 35% / reading 25%, grade F, #648 of 2,056 statewide, top 32%, 384 students, 0% FRL); Jersey Community Middle School (math 22% / reading 38%, grade F, #246 of 665 statewide, top 38%, 499 students, 0% FRL); Jersey Comm High School (math 23% / reading 30%, grade F, #241 of 693 statewide, top 35%, 1,006 students, 0% FRL) — zoned schools average 0% FRL vs 41% district-wide (41 pts lower); this property's tenant base skews higher-income than the district average.
- Market conditions: 91 active listings in the ZIP; 101 units permitted in Jersey County in 2024 (68 in 5+ unit buildings).
- Jersey County population projected at -24% by 2050 — secular population decline; favor cash flow + early exit over multi-decade hold.
- 4 sale attempts since 4y ago with the ask held roughly flat each time — persistent listings suggest the price (not the market) is what's stuck; bring a comps-based counter.
- Current owner paid $96k; list at $169k implies a 77% gain — meaningful room to come down on a strong offer.
- By year 3, paydown + projected appreciation supports a ~$46k cash-out refi (75% LTV) — recoverable capital for the next deal without selling this one.
Questions for listing agent
- What do current leases actually rent for vs. the listed asking? Can we see a recent rent roll and the last 12 months of T-12 income?
- Built in 1963 — when were the roof, HVAC, electrical panel, plumbing, and water heater last replaced?
- Is there a deadline driving the sale (1031 exchange, divorce, estate, relocation)? That informs how much negotiation room exists.
- Schools are F-rated, which usually means shorter tenancies and higher turnover. Who's the typical renter profile here, and what's been the actual vacancy rate?
- Crime grade is D in this area — have there been break-ins, vandalism, or insurance claims at this property in the last 3 years? What carrier currently insures it and at what premium?
- The area grade is low — what's the realistic commute time and amenity access for the typical tenant pool here? Any planned neighborhood developments (good or bad) we should know about?
- What's the average days-on-market for RENTAL listings here right now (not sales)? A rising rental-DOM trend means longer vacancies and softer asking-rent achievability than the comps imply.
- What's the recent tenant-quality profile in this submarket — average credit score on applications, eviction rate, late-payment / NSF rate, and stable-employment percentage? A property-management company in the area should have these aggregated.
CashFlowRE · CFR-0CDZZGAQP15W9V
· Data 4 days ago
cashflowre.app · 2026-05-29