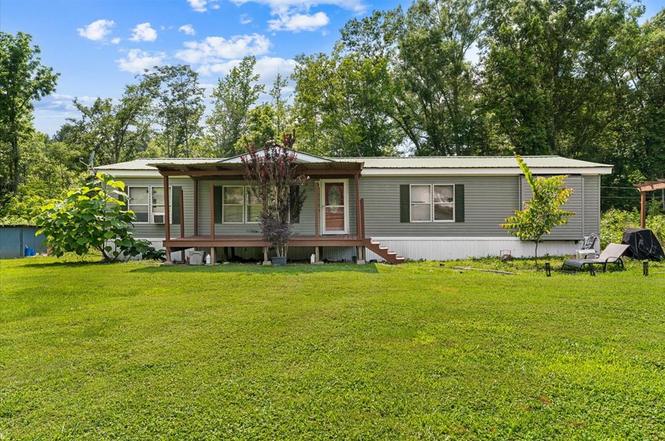
1637 Flat Branch Rd
Tunnel Hill, GA 30755
$165,000C-
3 bd · 2.0 ba ·
1,680 sqft ·
Built 1996
· Manufactured
· Active
· 6 DOM
Cashflow @ list (25.0% down · 7.5%)
Estimated rent
$1,535/mo
Mortgage (P&I)
−$865
Tax + insurance
−$341
HOA
−$0
Vac / Maint / Mgmt
−$322
Net cashflow
$6/mo
Annual
$75/yr
Cap rate
6.82%
Cash-on-cash
1.89%
DSCR
1.08
1% rule
0.93%
Cash to close
$46,200
Investor read
- This is a 3-bed/2.0-bath manufactured listed at $165k.
- At list price, monthly cash flow is $6 ($75/yr) — positive.
- The deal already cash-flows at list — no discount required.
- To meet the 1% rule (rent ≥ 1% of price), the offer needs to be $154k (6.9% below list).
- Only 6 days on market — expect competitive offers; lowballing is unlikely to land.
- Recommended offer: $154k (6.9% below list) — sets the bar for 1% rule.
- Local home prices are declining (-3.0%/yr); year-one equity from $1k of loan paydown is wiped out by about $5k of value loss. Plan a longer hold.
- Location reads 67/100 on livability (#164 in GA) — a middle-class / working-renter tenant base. Strengths: crime A+, cost of living A+, housing A+; Watch: amenities F, commute F, health & safety F.
- Whitfield County (rural): math 37% / reading 34% proficiency, ranked #62 of 174 in GA (top 36%) — families likely to look elsewhere, expect single-tenant / working-renter base with shorter leases; 61% free/reduced lunch — lower-income household profile, screen leases tightly.
- Zoned schools: New Hope Elementary School (math 43% / reading 31%, grade F, #485 of 1,228 statewide, top 41%, 511 students, 64% FRL); New Hope Middle School (math 45% / reading 48%, grade D+, #94 of 470 statewide, top 20%, 452 students, 61% FRL); Northwest Whitfield County High School (math 29% / reading 34%, grade F, #122 of 424 statewide, top 30%, 1,219 students, 49% FRL) — zoned schools at 58% FRL track the district average.
- Watch-outs: flood insurance adds $66/mo.
- Market conditions: 64 active listings in the ZIP; 374 units permitted in Whitfield County in 2024 (35 in 5+ unit buildings).
- Whitfield County population projected at +3% by 2050 — modest demand growth; plan on rents tracking national, not racing it.
- 2 sale attempts with the ask held roughly flat each time — persistent listings suggest the price (not the market) is what's stuck; bring a comps-based counter.
- Climate carrying-cost: major flood risk; moderate wildfire risk; extreme-heat days projected 7→19/yr by 2055 (HVAC capex compounding) — expect insurance premiums to compound above CPI over the hold.
- Cap rate 6.8% vs local median 4.0% in Tunnel Hill — top-decile yield for the area; either an underpriced asset or a hidden risk that comps aren't pricing in. Stress-test before assuming the spread holds.
Questions for listing agent
- What's the actual annual flood-insurance premium (NFIP or private), and is the property in a SFHA with mandatory coverage?
- Is there a deadline driving the sale (1031 exchange, divorce, estate, relocation)? That informs how much negotiation room exists.
- Schools are D-rated, which usually means shorter tenancies and higher turnover. Who's the typical renter profile here, and what's been the actual vacancy rate?
- What's the average days-on-market for RENTAL listings here right now (not sales)? A rising rental-DOM trend means longer vacancies and softer asking-rent achievability than the comps imply.
- What's the recent tenant-quality profile in this submarket — average credit score on applications, eviction rate, late-payment / NSF rate, and stable-employment percentage? A property-management company in the area should have these aggregated.
- How much new for-sale + rental construction is in the pipeline within 1–3 miles? Heavy new supply typically softens prices + rents 12–24 months out; constrained supply supports both.
CashFlowRE · CFR-0FB9610628SMV1
· Data 22 h ago
cashflowre.app · 2026-05-29