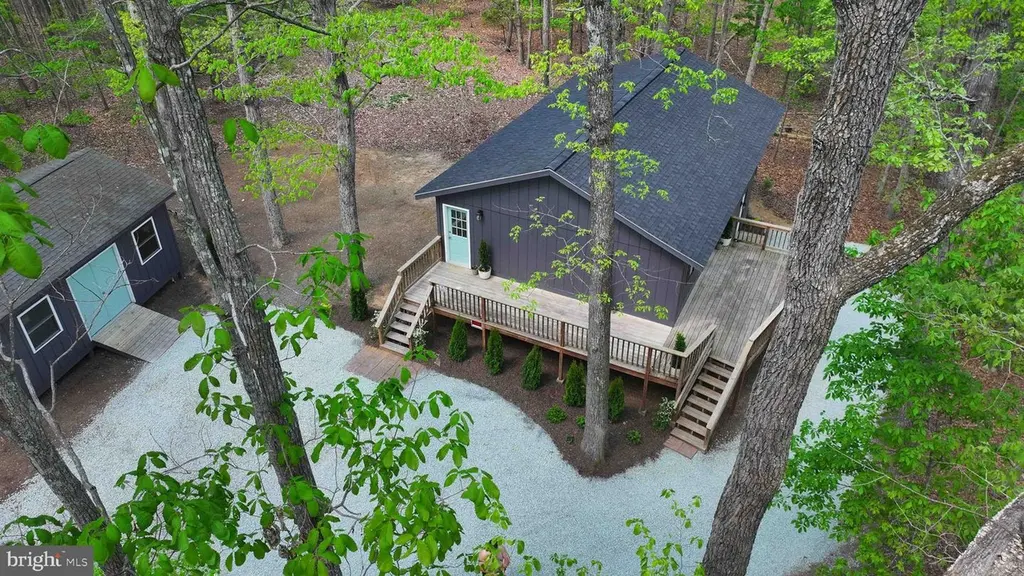
204 Union Mills Rd
Lake Monticello, VA 22974
$329,000C+
3 bd · 1.0 ba ·
960 sqft ·
Built 1978
· SingleFamily
· Pending
· 4 DOM
Cashflow @ list (25.0% down · 7.5%)
Estimated rent
$3,208/mo
Mortgage (P&I)
−$1,725
Tax + insurance
−$285
HOA
−$0
Vac / Maint / Mgmt
−$674
Net cashflow
$524/mo
Annual
$6,289/yr
Cap rate
8.20%
Cash-on-cash
6.83%
DSCR
1.30
1% rule
0.98%
Cash to close
$92,120
Investor read
- This is a 3-bed/1.0-bath single-family listed at $329k.
- At list price, monthly cash flow is $524 ($6k/yr) — positive.
- The deal already cash-flows at list — no discount required.
- To meet the 1% rule (rent ≥ 1% of price), the offer needs to be $321k (2.5% below list).
- Only 4 days on market — expect competitive offers; lowballing is unlikely to land.
- Recommended offer: $321k (2.5% below list) — sets the bar for 1% rule.
- In year one you build about $35k of equity ($2k loan paydown + $33k appreciation (10.0% local appreciation)).
- Location reads 67/100 on livability (#284 in VA) — a middle-class / working-renter tenant base. Strengths: employment A+, housing A+, crime A; Watch: amenities F, commute F, health & safety F.
- Fluvanna County Public School District (rural): math 61% / reading 71% proficiency, ranked #34 of 131 in VA (top 26%) — acceptable for families but not a draw, mixed tenant base, ~2y average lease.
- Zoned schools: Central Elementary (715 students, 52% FRL); Fluvanna Middle (math 65% / reading 70%, grade A-, #98 of 342 statewide, top 30%, 763 students, 42% FRL); Fluvanna County High (math 60% / reading 76%, grade B, #180 of 319 statewide, top 57%, 1,488 students, 37% FRL) — zoned schools average 44% FRL vs 23% district-wide (21 pts higher); higher-poverty schools than district average — tighter screening recommended.
- Market conditions: 28 active listings in the ZIP; 138 units permitted in Fluvanna County in 2024 (6 in 5+ unit buildings).
- At projected returns (10.0% appreciation + 3.0% rent growth), your $92k cash investment doubles in ~3 years — after that, you're playing with house money.
- By year 2, paydown + projected appreciation supports a ~$57k cash-out refi (75% LTV) — recoverable capital for the next deal without selling this one.
- Climate carrying-cost: extreme-heat days projected 7→17/yr by 2055 (HVAC capex compounding) — expect insurance premiums to compound above CPI over the hold.
- Cap rate 8.2% vs local median 3.6% in Lake Monticello — top-decile yield for the area; either an underpriced asset or a hidden risk that comps aren't pricing in. Stress-test before assuming the spread holds.
Questions for listing agent
- Built in 1978 — when were the roof, HVAC, electrical panel, plumbing, and water heater last replaced?
- Is there a deadline driving the sale (1031 exchange, divorce, estate, relocation)? That informs how much negotiation room exists.
- Schools are D-rated, which usually means shorter tenancies and higher turnover. Who's the typical renter profile here, and what's been the actual vacancy rate?
- What's the average days-on-market for RENTAL listings here right now (not sales)? A rising rental-DOM trend means longer vacancies and softer asking-rent achievability than the comps imply.
- What's the recent tenant-quality profile in this submarket — average credit score on applications, eviction rate, late-payment / NSF rate, and stable-employment percentage? A property-management company in the area should have these aggregated.
- How much new for-sale + rental construction is in the pipeline within 1–3 miles? Heavy new supply typically softens prices + rents 12–24 months out; constrained supply supports both.
CashFlowRE · CFR-0JW03425152S0Z
· Data 3 weeks ago
cashflowre.app · 2026-05-29