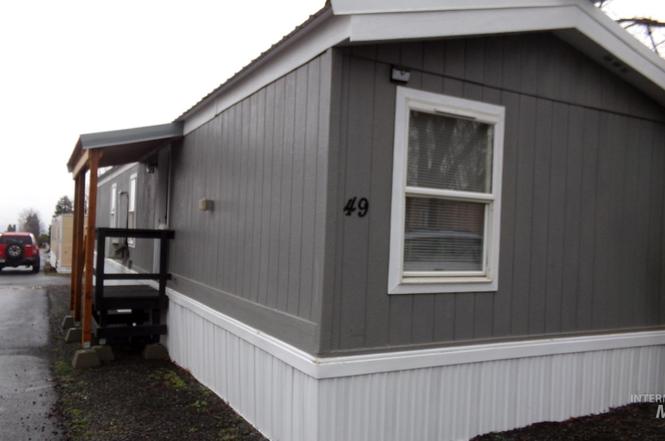
631 Preston #49
Lewiston, ID 83501
$83,500C+
2 bd · 2.0 ba ·
924 sqft ·
Built 1995
· SingleFamily
· Active
· 58 DOM
Cashflow @ list (25.0% down · 7.5%)
Estimated rent
$1,024/mo
Mortgage (P&I)
−$438
Tax + insurance
−$139
HOA
−$0
Vac / Maint / Mgmt
−$215
Net cashflow
$232/mo
Annual
$2,780/yr
Cap rate
9.62%
Cash-on-cash
11.89%
DSCR
1.53
1% rule
1.23%
Cash to close
$23,380
Investor read
- This is a 2-bed/2.0-bath single-family listed at $84k.
- At list price, monthly cash flow is $232 ($3k/yr) — positive.
- The deal already cash-flows at list — no discount required.
- Meets the 1% rule at list price ($1k rent vs $84k).
- It's been on market 58 days — a 3% lower offer ($81k) is reasonable based on typical stale-listing flexibility.
- Recommended offer: $81k (3.0% below list) — sets the bar for market timing.
- Local home prices are declining (-3.0%/yr); year-one equity from $577 of loan paydown is wiped out by about $3k of value loss. Plan a longer hold.
- Location reads 75/100 on livability (#30 in ID, #4,281 nationally) — a middle-class / working-renter tenant base. Strengths: housing A+, health & safety A+, cost of living A; Watch: amenities F, commute F.
- Lewiston Independent District (urban): math 44% / reading 54% proficiency, ranked #37 of 92 in ID (top 40%) — families likely to look elsewhere, expect single-tenant / working-renter base with shorter leases.
- Zoned schools: Mcghee Elementary School (math 37% / reading 52%, grade F, #199 of 357 statewide, top 59%, 257 students, 48% FRL); Lewiston High School (math 37% / reading 63%, grade D+, #39 of 169 statewide, top 23%, 1,373 students, 17% FRL) — zoned schools at 32% FRL track the district average.
- Market conditions: 272 active listings in the ZIP; 1 comparable units currently listed for rent nearby; 125 units permitted in Nez Perce County in 2024 (0 in 5+ unit buildings).
- Nez Perce County population projected at +12% by 2050 — modest demand growth; plan on rents tracking national, not racing it.
- 5 sale attempts since 11y ago with the ask held roughly flat each time — persistent listings suggest the price (not the market) is what's stuck; bring a comps-based counter.
- At projected returns (-3.0% appreciation + 3.0% rent growth), your $23k cash investment doubles in ~10 years — after that, you're playing with house money.
- Cap rate 9.6% vs local median 1.9% in Lewiston — top-decile yield for the area; either an underpriced asset or a hidden risk that comps aren't pricing in. Stress-test before assuming the spread holds.
- This rent is only 17% of the median local income ($74k/yr) — well below the 30% rent-burden line; pricing power to push rent on renewal without tenant pushback.
Questions for listing agent
- It's been on market 58 days. Have you received any prior offers? Is the seller open to a 3% concession, seller financing, or rate buy-down credit?
- Is there a deadline driving the sale (1031 exchange, divorce, estate, relocation)? That informs how much negotiation room exists.
- What's the average days-on-market for RENTAL listings here right now (not sales)? A rising rental-DOM trend means longer vacancies and softer asking-rent achievability than the comps imply.
- What's the recent tenant-quality profile in this submarket — average credit score on applications, eviction rate, late-payment / NSF rate, and stable-employment percentage? A property-management company in the area should have these aggregated.
- How much new for-sale + rental construction is in the pipeline within 1–3 miles? Heavy new supply typically softens prices + rents 12–24 months out; constrained supply supports both.
CashFlowRE · CFR-0P1WAJFHNF6JC8
· Data 1 day ago
cashflowre.app · 2026-05-29