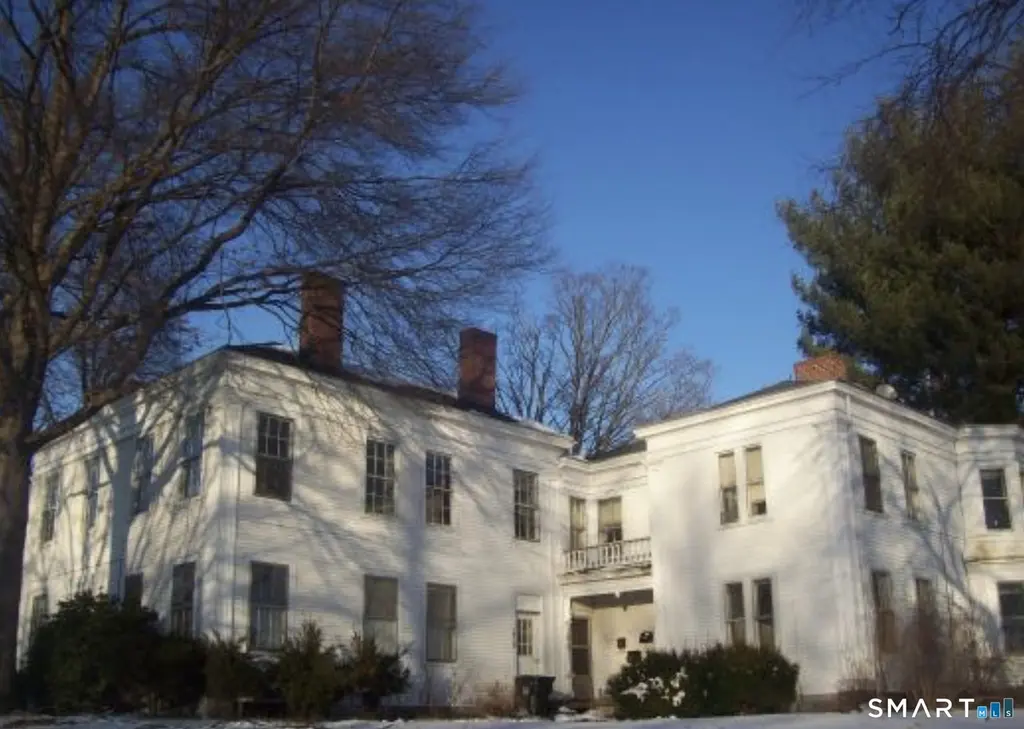
1418-1420 Main St
Newington, CT 06111
$749,000C
8 bd · 4.8 ba ·
5,916 sqft ·
Built 1834
· MultiFamily
· Active
· 159 DOM
Cashflow @ list (25.0% down · 7.5%)
Estimated rent
$9,821/mo
Mortgage (P&I)
−$3,928
Tax + insurance
−$1,461
HOA
−$0
Vac / Maint / Mgmt
−$2,062
Net cashflow
$2,370/mo
Annual
$28,441/yr
Cap rate
10.09%
Cash-on-cash
13.56%
DSCR
1.60
1% rule
1.31%
Cash to close
$209,720
Investor read
- This is a 4 × 2-bed/?-bath units multifamily listed at $749k.
- At list price, monthly cash flow is $2k ($28k/yr) — positive. Per door: $593/mo.
- The deal already cash-flows at list — no discount required.
- Meets the 1% rule at list price ($10k rent vs $749k).
- It's been on market 159 days — a 12% lower offer ($659k) is reasonable based on typical stale-listing flexibility.
- Recommended offer: $659k (12.0% below list) — sets the bar for market timing.
- Local home prices are declining (-3.0%/yr); year-one equity from $5k of loan paydown is wiped out by about $22k of value loss. Plan a longer hold.
- Location reads 79/100 on livability (#30 in CT, #2,143 nationally) — a middle-class / working-renter tenant base. Strengths: employment A+, housing A+, health & safety A+; Watch: amenities F, commute F.
- Newington School District (suburban): math 38% / reading 53% proficiency, ranked #87 of 153 in CT (top 57%) — families likely to look elsewhere, expect single-tenant / working-renter base with shorter leases; only 15% free/reduced lunch — higher-income household profile.
- Watch-outs: built in 1834 — expect roof / HVAC / electrical / plumbing capex.
- Market conditions: Rents flat; 94 active listings in the ZIP; solid renter incomes; 1,867 units permitted in Capitol Planning Region in 2024 (1,399 in 5+ unit buildings).
- 4 sale attempts since 3y ago; this cycle's ask has dropped $451k (38%) from the opening price — seller is motivated, your offer sets the floor, not the list.
- Current owner paid $425k; list at $749k implies a 76% gain — meaningful room to come down on a strong offer.
- Climate carrying-cost: major wind risk, 27% chance of damaging wind over 30y; extreme-heat days projected 7→16/yr by 2055 (HVAC capex compounding) — expect insurance premiums to compound above CPI over the hold.
- Cap rate 10.1% vs local median 4.3% in Newington — top-decile yield for the area; either an underpriced asset or a hidden risk that comps aren't pricing in. Stress-test before assuming the spread holds.
- At $9,821/mo this rent would consume 115% of the median local household income ($103k/yr) (locally 553% of renters already pay >50% of income on rent) — very limited rent-growth headroom before tenants either downsize or default.
Questions for listing agent
- It's been on market 159 days. Have you received any prior offers? Is the seller open to a 12% concession, seller financing, or rate buy-down credit?
- Can we see the unit-by-unit rent roll, current vacancy, and any below-market leases? What's the average tenancy length?
- What capital expenditures (roof, boiler, parking lot, exteriors) have been made in the last 5 years, and what's planned in the next 2?
- Built in 1834 — when were the roof, HVAC, electrical panel, plumbing, and water heater last replaced?
- Why hasn't it sold? Are there any deal-killer items the seller is aware of (foundation, flood, title, zoning, code violations)?
- Is there a deadline driving the sale (1031 exchange, divorce, estate, relocation)? That informs how much negotiation room exists.
- What's the average days-on-market for RENTAL listings here right now (not sales)? A rising rental-DOM trend means longer vacancies and softer asking-rent achievability than the comps imply.
- What's the recent tenant-quality profile in this submarket — average credit score on applications, eviction rate, late-payment / NSF rate, and stable-employment percentage? A property-management company in the area should have these aggregated.
CashFlowRE · CFR-0V07NK76M8H0V9
· Data 1 h ago
cashflowre.app · 2026-05-29