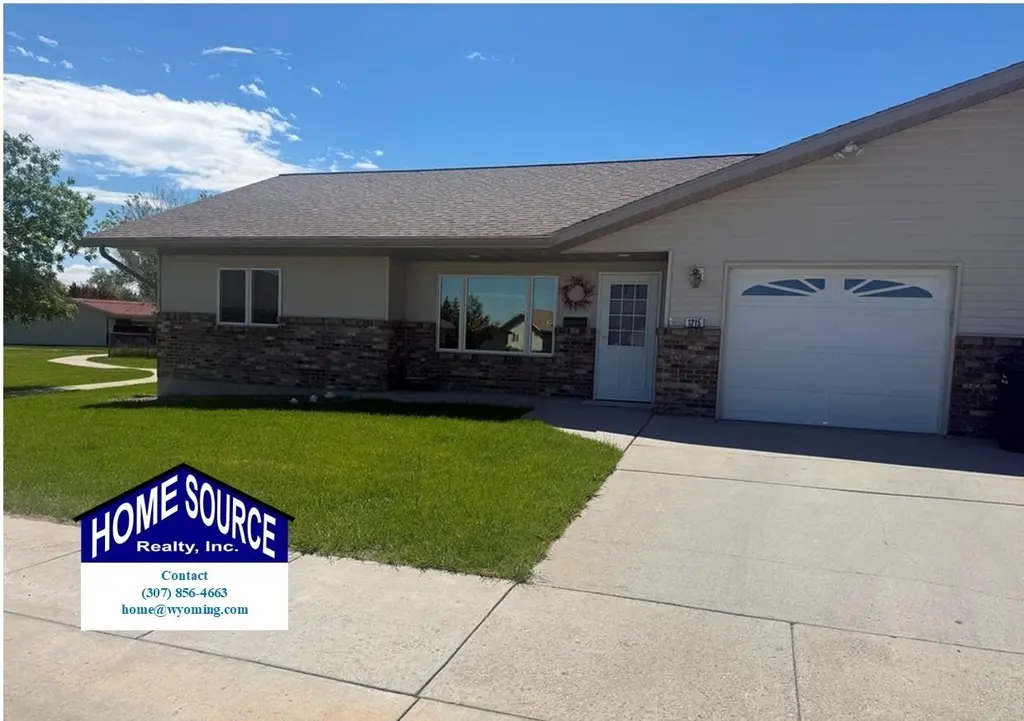
1215 Pioneer Ct
Riverton, WY 82501
$229,000D-
2 bd · 2.0 ba ·
1,220 sqft ·
Built 2007
· MultiFamily
· Active
· 17 DOM
Cashflow @ list (25.0% down · 7.5%)
Estimated rent
$2,098/mo
Mortgage (P&I)
−$1,201
Tax + insurance
−$190
HOA
−$312
Vac / Maint / Mgmt
−$441
Net cashflow
$-46/mo
Annual
$-547/yr
Cap rate
6.05%
Cash-on-cash
-0.85%
DSCR
0.96
1% rule
0.92%
Cash to close
$64,120
Investor read
- This is a 2-bed/2.0-bath multifamily listed at $229k.
- At list price, monthly cash flow is $-46 ($-547/yr) — negative.
- To cash-flow at today's rent, offer at most $221k (3.5% below list).
- To meet the 1% rule (rent ≥ 1% of price), the offer needs to be $210k (8.4% below list).
- It's been on market 17 days — a 2% lower offer ($226k) is reasonable based on typical stale-listing flexibility.
- Recommended offer: $210k (8.4% below list) — sets the bar for 1% rule.
- Local home prices are declining (-3.0%/yr); year-one equity from $2k of loan paydown is wiped out by about $7k of value loss. Plan a longer hold.
- Location reads 65/100 on livability (#79 in WY) — a middle-class / working-renter tenant base. Strengths: cost of living A+, housing A, health & safety A; Watch: schools C-, crime F, amenities F.
- Fremont County School District #25 (town): math 38% / reading 48% proficiency, ranked #36 of 41 in WY (top 88%) — families likely to look elsewhere, expect single-tenant / working-renter base with shorter leases.
- Market conditions: 189 active listings in the ZIP; 22 units permitted in Fremont County in 2024 (0 in 5+ unit buildings).
- Fremont County population projected at -13% by 2050 — secular population decline; favor cash flow + early exit over multi-decade hold.
- Climate carrying-cost: major wildfire risk — expect insurance premiums to compound above CPI over the hold.
- Cap rate 6.1% vs local median 3.7% in Riverton — top-decile yield for the area; either an underpriced asset or a hidden risk that comps aren't pricing in. Stress-test before assuming the spread holds.
- This rent runs 42% of the median local income ($60k/yr) — at the standard rent-burdened threshold; future hikes will face affordability resistance.
Questions for listing agent
- What do current leases actually rent for vs. the listed asking? Can we see a recent rent roll and the last 12 months of T-12 income?
- What does the HOA fee cover, when was the last increase, and are there any pending special assessments or reserve-fund shortfalls?
- Is there a deadline driving the sale (1031 exchange, divorce, estate, relocation)? That informs how much negotiation room exists.
- Crime grade is F in this area — have there been break-ins, vandalism, or insurance claims at this property in the last 3 years? What carrier currently insures it and at what premium?
- The area grade is low — what's the realistic commute time and amenity access for the typical tenant pool here? Any planned neighborhood developments (good or bad) we should know about?
- What's the average days-on-market for RENTAL listings here right now (not sales)? A rising rental-DOM trend means longer vacancies and softer asking-rent achievability than the comps imply.
- What's the recent tenant-quality profile in this submarket — average credit score on applications, eviction rate, late-payment / NSF rate, and stable-employment percentage? A property-management company in the area should have these aggregated.
- How much new apartment / multifamily construction is in the pipeline within 1–3 miles? Heavy new supply (>2% of stock underway) typically softens rents 12–24 months out; light construction supports rent growth.
CashFlowRE · CFR-0WV02R9300AVAG
· Data 1 day ago
cashflowre.app · 2026-05-29