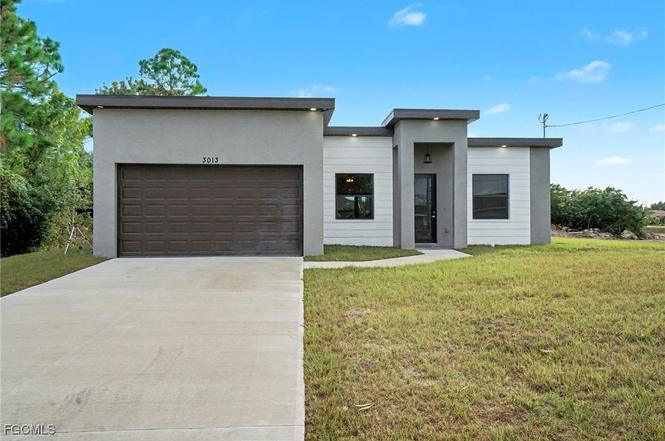
3013 4th St SW
Lehigh Acres, FL 33976
$301,997D+
3 bd · 2.0 ba ·
1,312 sqft ·
Built 2025
· Land
· Active
· 158 DOM
Cashflow @ list (25.0% down · 7.5%)
Estimated rent
$2,078/mo
Mortgage (P&I)
−$1,584
Tax + insurance
−$195
HOA
−$0
Vac / Maint / Mgmt
−$436
Net cashflow
$-137/mo
Annual
$-1,646/yr
Cap rate
5.75%
Cash-on-cash
-1.95%
DSCR
0.91
1% rule
0.69%
Cash to close
$84,559
Investor read
- This is a 3-bed/2.0-bath land listed at $302k.
- At list price, monthly cash flow is $-137 ($-2k/yr) — negative.
- To cash-flow at today's rent, offer at most $278k (8.0% below list).
- To meet the 1% rule (rent ≥ 1% of price), the offer needs to be $208k (31.2% below list).
- It's been on market 158 days — a 12% lower offer ($266k) is reasonable based on typical stale-listing flexibility.
- Recommended offer: $208k (31.2% below list) — sets the bar for 1% rule.
- In year one you build about $32k of equity ($2k loan paydown + $30k appreciation (10.0% local appreciation)).
- Location reads 59/100 on livability (#826 in FL) — a working-class tenant base; expect higher turnover. Strengths: cost of living A+, housing A+; Watch: crime C-, employment D+, schools D-.
- Lee (suburban): math 47% / reading 50% proficiency, ranked #42 of 73 in FL (top 58%) — families likely to look elsewhere, expect single-tenant / working-renter base with shorter leases.
- Market conditions: Rents soft (-1.5%/yr); 786 active listings in the ZIP; 40 comparable units currently listed for rent nearby; rentals at typical pace (median 20d on market — plan ~3-4 weeks tenant-placement turnaround); 15,411 units permitted in Lee County in 2024 (4,686 in 5+ unit buildings).
- Lee County population projected at +44% by 2050 — long-run rental-demand tailwind backs the buy-and-hold thesis.
- 7 sale attempts since 11y ago; this cycle's ask is 13946% above the opening price — seller raised mid-cycle; expect resistance to lowballs.
- Current owner paid $14k; list at $302k implies a 2057% gain — meaningful room to come down on a strong offer.
- By year 2, paydown + projected appreciation supports a ~$52k cash-out refi (75% LTV) — recoverable capital for the next deal without selling this one.
- Climate carrying-cost: severe wind risk, 99% chance of damaging wind over 30y; extreme-heat days projected 7→27/yr by 2055 (HVAC capex compounding) — expect insurance premiums to compound above CPI over the hold.
- Cap rate 5.7% vs local median 4.7% in Lehigh Acres — meaningfully above typical; check what's discounted (condition, days-on-market, listing class) to confirm the premium yield is real.
- This rent runs 34% of the median local income ($73k/yr) — at the standard rent-burdened threshold; future hikes will face affordability resistance.
Questions for listing agent
- What do current leases actually rent for vs. the listed asking? Can we see a recent rent roll and the last 12 months of T-12 income?
- It's been on market 158 days. Have you received any prior offers? Is the seller open to a 31% concession, seller financing, or rate buy-down credit?
- Why hasn't it sold? Are there any deal-killer items the seller is aware of (foundation, flood, title, zoning, code violations)?
- Is there a deadline driving the sale (1031 exchange, divorce, estate, relocation)? That informs how much negotiation room exists.
- Schools are D-rated, which usually means shorter tenancies and higher turnover. Who's the typical renter profile here, and what's been the actual vacancy rate?
- The area grade is low — what's the realistic commute time and amenity access for the typical tenant pool here? Any planned neighborhood developments (good or bad) we should know about?
- What's the average days-on-market for RENTAL listings here right now (not sales)? A rising rental-DOM trend means longer vacancies and softer asking-rent achievability than the comps imply.
- What's the recent tenant-quality profile in this submarket — average credit score on applications, eviction rate, late-payment / NSF rate, and stable-employment percentage? A property-management company in the area should have these aggregated.
CashFlowRE · CFR-0XTJMX0JM2HD9C
· Data 3 days ago
cashflowre.app · 2026-05-29