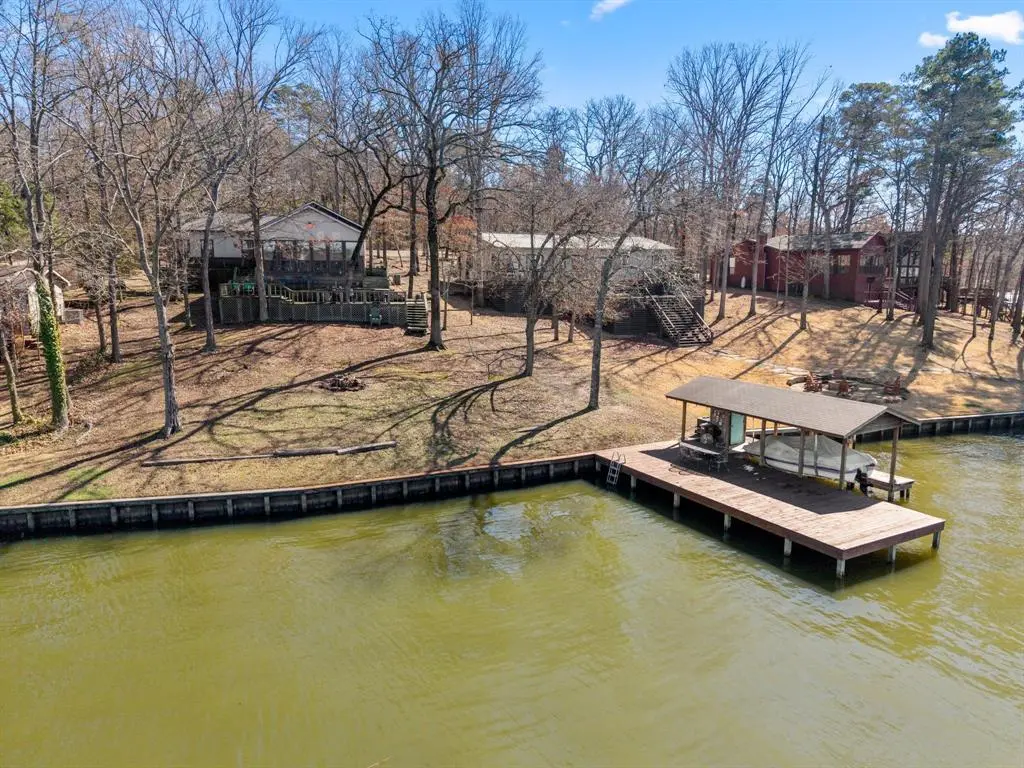
305 South Park Rd
Mount Vernon, TX 75480
$629,000D
3 bd · 1.0 ba ·
1,620 sqft ·
Built 1991
· SingleFamily
· Active
· 115 DOM
Cashflow @ list (25.0% down · 7.5%)
Estimated rent
$3,450/mo
Mortgage (P&I)
−$3,299
Tax + insurance
−$1,069
HOA
−$0
Vac / Maint / Mgmt
−$724
Net cashflow
$-1,642/mo
Annual
$-19,706/yr
Cap rate
3.16%
Cash-on-cash
-11.19%
DSCR
0.50
1% rule
0.55%
Cash to close
$176,120
Investor read
- This is a 3-bed/1.0-bath single-family listed at $629k.
- At list price, monthly cash flow is $-2k ($-20k/yr) — negative.
- To cash-flow at today's rent, offer at most $339k (46.1% below list).
- To meet the 1% rule (rent ≥ 1% of price), the offer needs to be $345k (45.2% below list).
- It's been on market 115 days — a 9% lower offer ($572k) is reasonable based on typical stale-listing flexibility.
- Recommended offer: $339k (46.1% below list) — sets the bar for cash-flow.
- In year one you build about $37k of equity ($4k loan paydown + $32k appreciation (5.1% local appreciation)).
- Location reads 74/100 on livability (#190 in TX, #4,869 nationally) — a middle-class / working-renter tenant base. Strengths: cost of living A+, housing A+, health & safety A+; Watch: employment D+, amenities F, commute F.
- Mount Vernon ISD (town): math 49% / reading 43% proficiency, ranked #251 of 826 in TX (top 30%) — families likely to look elsewhere, expect single-tenant / working-renter base with shorter leases.
- Market conditions: 96 active listings in the ZIP; 1 comparable units currently listed for rent nearby; 7 units permitted in Franklin County in 2024 (0 in 5+ unit buildings).
- 4 sale attempts since 9y ago with the ask held roughly flat each time — persistent listings suggest the price (not the market) is what's stuck; bring a comps-based counter.
- By year 2, paydown + projected appreciation supports a ~$59k cash-out refi (75% LTV) — recoverable capital for the next deal without selling this one.
- Climate carrying-cost: major wind risk, 27% chance of damaging wind over 30y; extreme-heat days projected 7→24/yr by 2055 (HVAC capex compounding) — expect insurance premiums to compound above CPI over the hold.
- Cap rate 3.2% vs local median 1.7% in Mount Vernon — top-decile yield for the area; either an underpriced asset or a hidden risk that comps aren't pricing in. Stress-test before assuming the spread holds.
Questions for listing agent
- What do current leases actually rent for vs. the listed asking? Can we see a recent rent roll and the last 12 months of T-12 income?
- It's been on market 115 days. Have you received any prior offers? Is the seller open to a 46% concession, seller financing, or rate buy-down credit?
- Why hasn't it sold? Are there any deal-killer items the seller is aware of (foundation, flood, title, zoning, code violations)?
- Is there a deadline driving the sale (1031 exchange, divorce, estate, relocation)? That informs how much negotiation room exists.
- The area grade is low — what's the realistic commute time and amenity access for the typical tenant pool here? Any planned neighborhood developments (good or bad) we should know about?
- What's the average days-on-market for RENTAL listings here right now (not sales)? A rising rental-DOM trend means longer vacancies and softer asking-rent achievability than the comps imply.
- What's the recent tenant-quality profile in this submarket — average credit score on applications, eviction rate, late-payment / NSF rate, and stable-employment percentage? A property-management company in the area should have these aggregated.
- How much new for-sale + rental construction is in the pipeline within 1–3 miles? Heavy new supply typically softens prices + rents 12–24 months out; constrained supply supports both.
CashFlowRE · CFR-109678C3P2D415
· Data 1 day ago
cashflowre.app · 2026-05-29