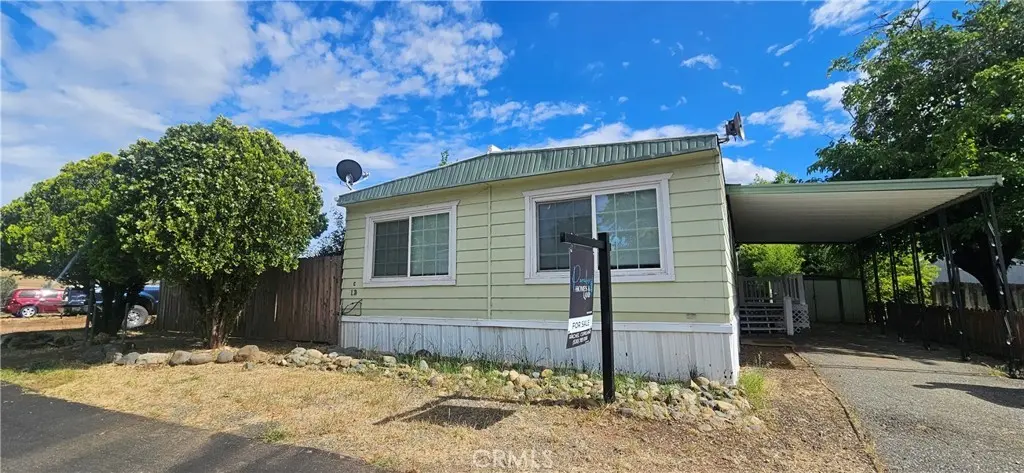
2920 Clark Unit C12
Butte Valley, CA 95965
$40,000D
3 bd · 2.0 ba ·
1,536 sqft ·
Built 1973
· Manufactured
· Active
· 25 DOM
Cashflow @ list (25.0% down · 7.5%)
Estimated rent
$1,744/mo
Mortgage (P&I)
−$210
Tax + insurance
−$60
HOA
−$0
Vac / Maint / Mgmt
−$366
Net cashflow
$1,108/mo
Annual
$13,294/yr
Cap rate
39.53%
Cash-on-cash
118.70%
DSCR
6.28
1% rule
4.36%
Cash to close
$11,200
Investor read
- This is a 3-bed/2.0-bath manufactured listed at $40k.
- At list price, monthly cash flow is $1k ($13k/yr) — positive.
- The deal already cash-flows at list — no discount required.
- Meets the 1% rule at list price ($2k rent vs $40k).
- It's been on market 25 days — a 2% lower offer ($39k) is reasonable based on typical stale-listing flexibility.
- Recommended offer: $39k (1.5% below list) — sets the bar for market timing.
- Local home prices are declining (-3.0%/yr); year-one equity from $277 of loan paydown is wiped out by about $1k of value loss. Plan a longer hold.
- Location reads 50/100 on livability (#1,130 in CA) — a working-class tenant base; expect higher turnover. Strengths: employment A+, housing A; Watch: crime C-, amenities F, commute F.
- Durham Unified (rural): math 40% / reading 48% proficiency, ranked #180 of 517 in CA (top 35%) — families likely to look elsewhere, expect single-tenant / working-renter base with shorter leases.
- Zoned schools: Durham Elementary (math 45% / reading 51%, grade D, #451 of 1,571 statewide, top 29%, 461 students, 37% FRL); Durham Intermediate (math 34% / reading 43%, grade F, #159 of 498 statewide, top 32%, 225 students, 44% FRL); Durham High (math 44% / reading 54%, grade D, #352 of 1,170 statewide, top 31%, 310 students, 37% FRL).
- Market conditions: Rents rising (+1.9%/yr); 167 active listings in the ZIP; 946 units permitted in Butte County in 2024 (254 in 5+ unit buildings).
- Butte County population projected at +10% by 2050 — modest demand growth; plan on rents tracking national, not racing it.
- 2 sale attempts since 3y ago with the ask held roughly flat each time — persistent listings suggest the price (not the market) is what's stuck; bring a comps-based counter.
- At projected returns (-3.0% appreciation + 1.9% rent growth), your $11k cash investment doubles in ~1 year — after that, you're playing with house money.
- Climate carrying-cost: severe wildfire risk; extreme-heat days projected 7→17/yr by 2055 (HVAC capex compounding) — expect insurance premiums to compound above CPI over the hold.
- This rent runs 39% of the median local income ($53k/yr) — at the standard rent-burdened threshold; future hikes will face affordability resistance.
Questions for listing agent
- Built in 1973 — when were the roof, HVAC, electrical panel, plumbing, and water heater last replaced?
- Is there a deadline driving the sale (1031 exchange, divorce, estate, relocation)? That informs how much negotiation room exists.
- The area grade is low — what's the realistic commute time and amenity access for the typical tenant pool here? Any planned neighborhood developments (good or bad) we should know about?
- What's the average days-on-market for RENTAL listings here right now (not sales)? A rising rental-DOM trend means longer vacancies and softer asking-rent achievability than the comps imply.
- What's the recent tenant-quality profile in this submarket — average credit score on applications, eviction rate, late-payment / NSF rate, and stable-employment percentage? A property-management company in the area should have these aggregated.
- How much new for-sale + rental construction is in the pipeline within 1–3 miles? Heavy new supply typically softens prices + rents 12–24 months out; constrained supply supports both.
CashFlowRE · CFR-12H9413Z0ZERHP
· Data 2 h ago
cashflowre.app · 2026-05-29