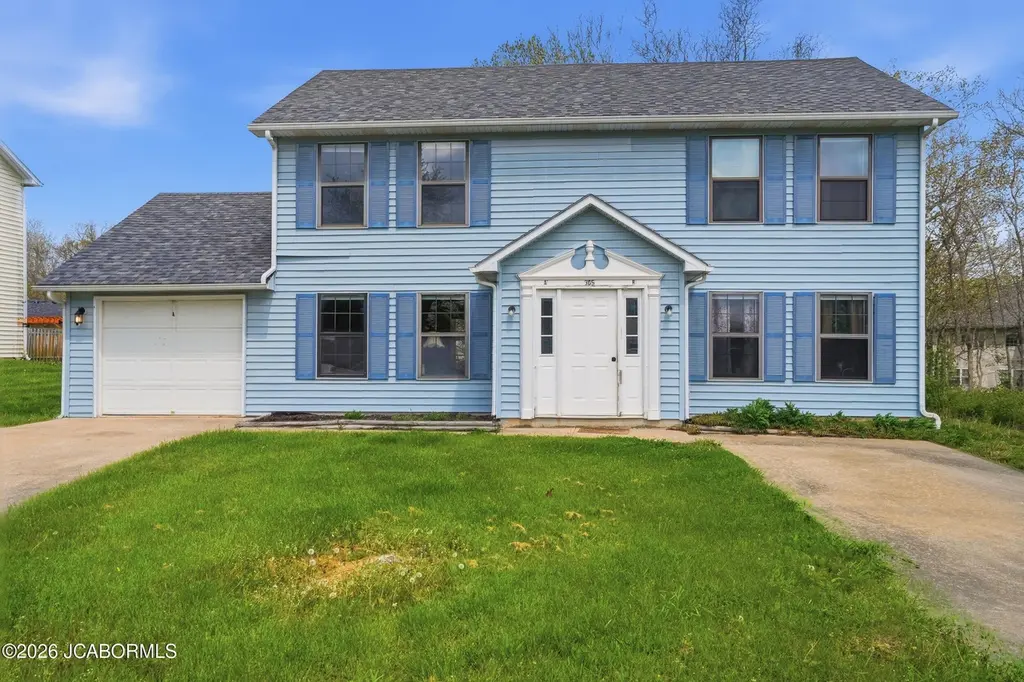
305 E Liberty Ln Unit A&B
Ashland, MO 65010
$335,000F
None bd · None ba ·
— sqft ·
Built 1992
· Condo
· Active
· 65 DOM
Cashflow @ list (25.0% down · 7.5%)
Estimated rent
$2,136/mo
Mortgage (P&I)
−$1,757
Tax + insurance
−$558
HOA
−$0
Vac / Maint / Mgmt
−$449
Net cashflow
$-628/mo
Annual
$-7,533/yr
Cap rate
4.04%
Cash-on-cash
-8.03%
DSCR
0.64
1% rule
0.64%
Cash to close
$93,800
Investor read
- This is a condo listed at $335k. Condition is rated good.
- At list price, monthly cash flow is $-628 ($-8k/yr) — negative.
- To cash-flow at today's rent, offer at most $244k (27.1% below list).
- To meet the 1% rule (rent ≥ 1% of price), the offer needs to be $214k (36.2% below list).
- It's been on market 65 days — a 6% lower offer ($315k) is reasonable based on typical stale-listing flexibility.
- Recommended offer: $214k (36.2% below list) — sets the bar for 1% rule.
- Local home prices are declining (-3.0%/yr); year-one equity from $2k of loan paydown is wiped out by about $10k of value loss. Plan a longer hold.
- Location reads 69/100 on livability (#155 in MO) — a middle-class / working-renter tenant base. Strengths: employment A+, cost of living A+, housing A+; Watch: amenities F, commute F, health & safety F.
- Southern Boone County R-I (rural): math 42% / reading 48% proficiency, ranked #66 of 324 in MO (top 20%) — families likely to look elsewhere, expect single-tenant / working-renter base with shorter leases; only 16% free/reduced lunch — higher-income household profile.
- Zoned schools: Southern Boone Primary (493 students, 14% FRL); Southern Boone Middle (math 38% / reading 44%, grade F, #172 of 391 statewide, top 46%, 629 students, 16% FRL); Southern Boone High (math 52% / reading 52%, grade D+, #92 of 521 statewide, top 20%, 540 students, 12% FRL) — zoned schools at 14% FRL track the district average.
- Market conditions: 133 active listings in the ZIP; 4 comparable units currently listed for rent nearby; rentals at typical pace (median 16d on market — plan ~3-4 weeks tenant-placement turnaround); 1,303 units permitted in Boone County in 2024 (549 in 5+ unit buildings).
- Boone County population projected at +36% by 2050 — long-run rental-demand tailwind backs the buy-and-hold thesis.
- 5 sale attempts since 10y ago with the ask held roughly flat each time — persistent listings suggest the price (not the market) is what's stuck; bring a comps-based counter.
- Cap rate 4.0% vs local median 3.1% in Ashland — top-decile yield for the area; either an underpriced asset or a hidden risk that comps aren't pricing in. Stress-test before assuming the spread holds.
Questions for listing agent
- What do current leases actually rent for vs. the listed asking? Can we see a recent rent roll and the last 12 months of T-12 income?
- It's been on market 65 days. Have you received any prior offers? Is the seller open to a 36% concession, seller financing, or rate buy-down credit?
- Any open or pending special assessments — roof, HVAC, plumbing, elevator, façade? What's the per-unit balance and payoff schedule, and is the seller paying it off at close or rolling it to the buyer?
- Why hasn't it sold? Are there any deal-killer items the seller is aware of (foundation, flood, title, zoning, code violations)?
- Is there a deadline driving the sale (1031 exchange, divorce, estate, relocation)? That informs how much negotiation room exists.
- The area grade is low — what's the realistic commute time and amenity access for the typical tenant pool here? Any planned neighborhood developments (good or bad) we should know about?
- What's the average days-on-market for RENTAL listings here right now (not sales)? A rising rental-DOM trend means longer vacancies and softer asking-rent achievability than the comps imply.
- What's the recent tenant-quality profile in this submarket — average credit score on applications, eviction rate, late-payment / NSF rate, and stable-employment percentage? A property-management company in the area should have these aggregated.
CashFlowRE · CFR-14308GB0MKXJ0S
· Data 3 h ago
cashflowre.app · 2026-05-29