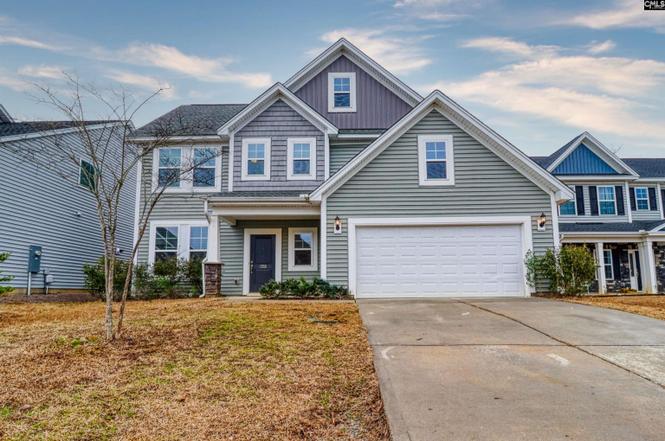
1355 Tamarind Ln
Lake Murray of Richland, SC 29036
$325,000D-
4 bd · 2.5 ba ·
2,332 sqft ·
Built 2020
· SingleFamily
· Active
· 127 DOM
Cashflow @ list (25.0% down · 7.5%)
Estimated rent
$2,835/mo
Mortgage (P&I)
−$1,704
Tax + insurance
−$633
HOA
−$35
Vac / Maint / Mgmt
−$595
Net cashflow
$-132/mo
Annual
$-1,589/yr
Cap rate
5.80%
Cash-on-cash
-1.75%
DSCR
0.92
1% rule
0.87%
Cash to close
$91,000
Investor read
- This is a 4-bed/2.5-bath single-family listed at $325k.
- At list price, monthly cash flow is $-132 ($-2k/yr) — negative.
- To cash-flow at today's rent, offer at most $302k (7.2% below list).
- To meet the 1% rule (rent ≥ 1% of price), the offer needs to be $284k (12.8% below list).
- It's been on market 127 days — a 12% lower offer ($286k) is reasonable based on typical stale-listing flexibility.
- Recommended offer: $284k (12.8% below list) — sets the bar for 1% rule.
- Local home prices are declining (-3.0%/yr); year-one equity from $2k of loan paydown is wiped out by about $10k of value loss. Plan a longer hold.
- Location reads 67/100 on livability (#102 in SC) — a middle-class / working-renter tenant base. Strengths: crime A+, employment A+, housing A+; Watch: amenities F, commute F, cost of living F.
- Lexington 05 (suburban): math 47% / reading 55% proficiency, ranked #5 of 80 in SC (top 6%) — acceptable for families but not a draw, mixed tenant base, ~2y average lease.
- Zoned schools: Lake Murray Elementary (math 78% / reading 82%, grade A+, #4 of 597 statewide, top 1%, 809 students, 18% FRL); Chapin High (math 82% / reading 91%, grade A, #7 of 196 statewide, top 4%, 1,615 students, 100% FRL) — zoned schools average 59% FRL vs 27% district-wide (32 pts higher); higher-poverty schools than district average — tighter screening recommended.
- Zoned-school proficiency averages 83% at this address vs 51% district-wide (+32 pts) — the actual schools serving this property are materially stronger than the Lexington 05 average implies; a family-tenant draw the district grade alone would hide.
- Market conditions: 434 active listings in the ZIP; 3 comparable units currently listed for rent nearby; rentals leasing fast (median 12d on market — plan ~1-2 weeks tenant-placement turnaround); high-income renter base; 1,712 units permitted in Lexington County in 2024 (0 in 5+ unit buildings).
- Lexington County population projected at +26% by 2050 — long-run rental-demand tailwind backs the buy-and-hold thesis.
- Current owner paid $195k; list at $325k implies a 67% gain — meaningful room to come down on a strong offer.
- Climate carrying-cost: major wind risk, 66% chance of damaging wind over 30y; extreme-heat days projected 7→16/yr by 2055 (HVAC capex compounding) — expect insurance premiums to compound above CPI over the hold.
Questions for listing agent
- What do current leases actually rent for vs. the listed asking? Can we see a recent rent roll and the last 12 months of T-12 income?
- It's been on market 127 days. Have you received any prior offers? Is the seller open to a 13% concession, seller financing, or rate buy-down credit?
- What does the HOA fee cover, when was the last increase, and are there any pending special assessments or reserve-fund shortfalls?
- Why hasn't it sold? Are there any deal-killer items the seller is aware of (foundation, flood, title, zoning, code violations)?
- Is there a deadline driving the sale (1031 exchange, divorce, estate, relocation)? That informs how much negotiation room exists.
- Schools are D-rated, which usually means shorter tenancies and higher turnover. Who's the typical renter profile here, and what's been the actual vacancy rate?
- The area grade is low — what's the realistic commute time and amenity access for the typical tenant pool here? Any planned neighborhood developments (good or bad) we should know about?
- What's the average days-on-market for RENTAL listings here right now (not sales)? A rising rental-DOM trend means longer vacancies and softer asking-rent achievability than the comps imply.
CashFlowRE · CFR-14DFDEFGPV5GKQ
· Data 2 days ago
cashflowre.app · 2026-05-29