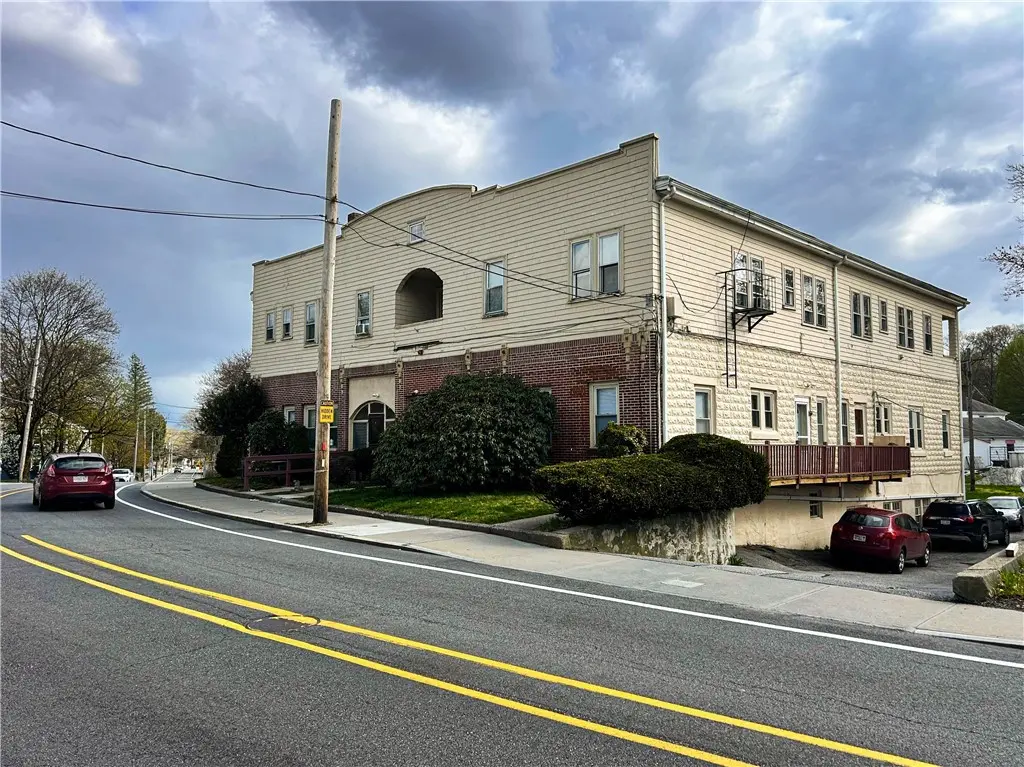
372 Old River Rd
Cumberland Hill, RI 02838
$849,000B+
77 bd · 28.0 ba ·
7,198 sqft ·
Built 1920
· MultiFamily
· Pending
· 10 DOM
Cashflow @ list (25.0% down · 7.5%)
Estimated rent
$14,987/mo
Mortgage (P&I)
−$4,452
Tax + insurance
−$1,079
HOA
−$0
Vac / Maint / Mgmt
−$3,147
Net cashflow
$6,308/mo
Annual
$75,702/yr
Cap rate
15.21%
Cash-on-cash
31.84%
DSCR
2.42
1% rule
1.77%
Cash to close
$237,720
Investor read
- This is a 7 × 11-bed/4.0-bath units multifamily listed at $849k.
- At list price, monthly cash flow is $6k ($76k/yr) — positive. Per door: $901/mo.
- The deal already cash-flows at list — no discount required.
- Meets the 1% rule at list price ($15k rent vs $849k).
- Only 10 days on market — expect competitive offers; lowballing is unlikely to land.
- In year one you build about $64k of equity ($6k loan paydown + $58k appreciation (6.8% local appreciation)).
- Location reads 74/100 on livability (#11 in RI, #4,666 nationally) — a middle-class / working-renter tenant base. Strengths: crime A+, employment A+, housing A+; Watch: amenities F, commute F.
- Lincoln (suburban): math 38% / reading 48% proficiency, ranked #13 of 39 in RI (top 33%) — families likely to look elsewhere, expect single-tenant / working-renter base with shorter leases.
- Watch-outs: built in 1920 — expect roof / HVAC / electrical / plumbing capex.
- Market conditions: 21 active listings in the ZIP; 776 units permitted in Providence County in 2024 (229 in 5+ unit buildings).
- Providence County population projected at +5% by 2050 — modest demand growth; plan on rents tracking national, not racing it.
- At projected returns (6.8% appreciation + 3.0% rent growth), your $238k cash investment doubles in ~2 years — after that, you're playing with house money.
- By year 2, paydown + projected appreciation supports a ~$102k cash-out refi (75% LTV) — recoverable capital for the next deal without selling this one.
- Climate carrying-cost: moderate flood risk; major wind risk, 64% chance of damaging wind over 30y; extreme-heat days projected 7→15/yr by 2055 (HVAC capex compounding) — expect insurance premiums to compound above CPI over the hold.
- Cap rate 15.2% vs local median 3.3% in Cumberland Hill — top-decile yield for the area; either an underpriced asset or a hidden risk that comps aren't pricing in. Stress-test before assuming the spread holds.
Questions for listing agent
- Can we see the unit-by-unit rent roll, current vacancy, and any below-market leases? What's the average tenancy length?
- What capital expenditures (roof, boiler, parking lot, exteriors) have been made in the last 5 years, and what's planned in the next 2?
- Built in 1920 — when were the roof, HVAC, electrical panel, plumbing, and water heater last replaced?
- Is there a deadline driving the sale (1031 exchange, divorce, estate, relocation)? That informs how much negotiation room exists.
- What's the average days-on-market for RENTAL listings here right now (not sales)? A rising rental-DOM trend means longer vacancies and softer asking-rent achievability than the comps imply.
- What's the recent tenant-quality profile in this submarket — average credit score on applications, eviction rate, late-payment / NSF rate, and stable-employment percentage? A property-management company in the area should have these aggregated.
- How much new apartment / multifamily construction is in the pipeline within 1–3 miles? Heavy new supply (>2% of stock underway) typically softens rents 12–24 months out; light construction supports rent growth.
CashFlowRE · CFR-169NEM3WPKRB8S
· Data 3 weeks ago
cashflowre.app · 2026-05-29