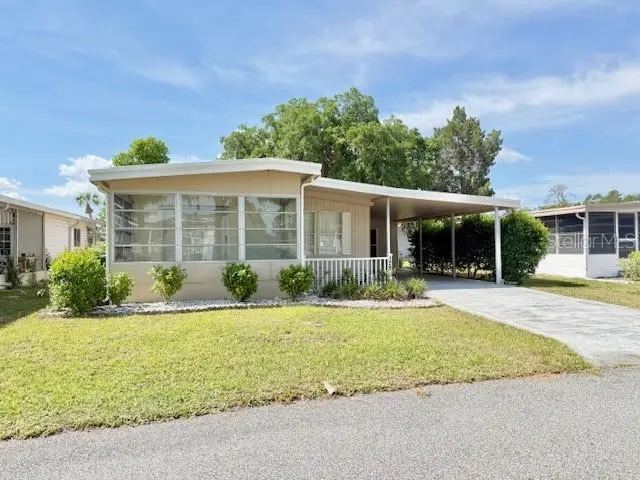
129 Malayon Way
Leesburg, FL 34788
$70,000B-
2 bd · 2.0 ba ·
828 sqft ·
Built 1979
· Condo
· Pending
· 33 DOM
Cashflow @ list (25.0% down · 7.5%)
Estimated rent
$1,609/mo
Mortgage (P&I)
−$367
Tax + insurance
−$169
HOA
−$215
Vac / Maint / Mgmt
−$338
Net cashflow
$520/mo
Annual
$6,240/yr
Cap rate
15.21%
Cash-on-cash
31.84%
DSCR
2.42
1% rule
2.30%
Cash to close
$19,600
Investor read
- This is a 2-bed/2.0-bath condo listed at $70k.
- At list price, monthly cash flow is $520 ($6k/yr) — positive.
- The deal already cash-flows at list — no discount required.
- Meets the 1% rule at list price ($2k rent vs $70k).
- It's been on market 33 days — a 3% lower offer ($68k) is reasonable based on typical stale-listing flexibility.
- Recommended offer: $68k (3.0% below list) — sets the bar for market timing.
- Local home prices are declining (-3.0%/yr); year-one equity from $484 of loan paydown is wiped out by about $2k of value loss. Plan a longer hold.
- Location reads 62/100 on livability (#751 in FL) — a middle-class / working-renter tenant base. Strengths: cost of living A+, housing A+; Watch: schools D+, crime D, amenities F.
- Lake (suburban): math 49% / reading 50% proficiency, ranked #37 of 73 in FL (top 51%) — families likely to look elsewhere, expect single-tenant / working-renter base with shorter leases.
- Market conditions: 285 active listings in the ZIP; 2 comparable units currently listed for rent nearby; 4,799 units permitted in Lake County in 2024 (814 in 5+ unit buildings).
- Lake County population projected at +37% by 2050 — long-run rental-demand tailwind backs the buy-and-hold thesis.
- 2 sale attempts; this cycle's ask has dropped $5k (7%) from the opening price — seller is motivated, your offer sets the floor, not the list.
- At projected returns (-3.0% appreciation + 3.0% rent growth), your $20k cash investment doubles in ~4 years — after that, you're playing with house money.
- Climate carrying-cost: severe wind risk, 99% chance of damaging wind over 30y; extreme-heat days projected 7→22/yr by 2055 (HVAC capex compounding) — expect insurance premiums to compound above CPI over the hold.
- Cap rate 15.2% vs local median 4.5% in Leesburg — top-decile yield for the area; either an underpriced asset or a hidden risk that comps aren't pricing in. Stress-test before assuming the spread holds.
- This rent runs 36% of the median local income ($54k/yr) — at the standard rent-burdened threshold; future hikes will face affordability resistance.
Questions for listing agent
- It's been on market 33 days. Have you received any prior offers? Is the seller open to a 3% concession, seller financing, or rate buy-down credit?
- Built in 1979 — when were the roof, HVAC, electrical panel, plumbing, and water heater last replaced?
- What does the HOA fee cover, when was the last increase, and are there any pending special assessments or reserve-fund shortfalls?
- Any open or pending special assessments — roof, HVAC, plumbing, elevator, façade? What's the per-unit balance and payoff schedule, and is the seller paying it off at close or rolling it to the buyer?
- Is there a deadline driving the sale (1031 exchange, divorce, estate, relocation)? That informs how much negotiation room exists.
- Schools are D-rated, which usually means shorter tenancies and higher turnover. Who's the typical renter profile here, and what's been the actual vacancy rate?
- Crime grade is D in this area — have there been break-ins, vandalism, or insurance claims at this property in the last 3 years? What carrier currently insures it and at what premium?
- What's the average days-on-market for RENTAL listings here right now (not sales)? A rising rental-DOM trend means longer vacancies and softer asking-rent achievability than the comps imply.
CashFlowRE · CFR-19JE2P5F7SN8DV
· Data 1 week ago
cashflowre.app · 2026-05-29