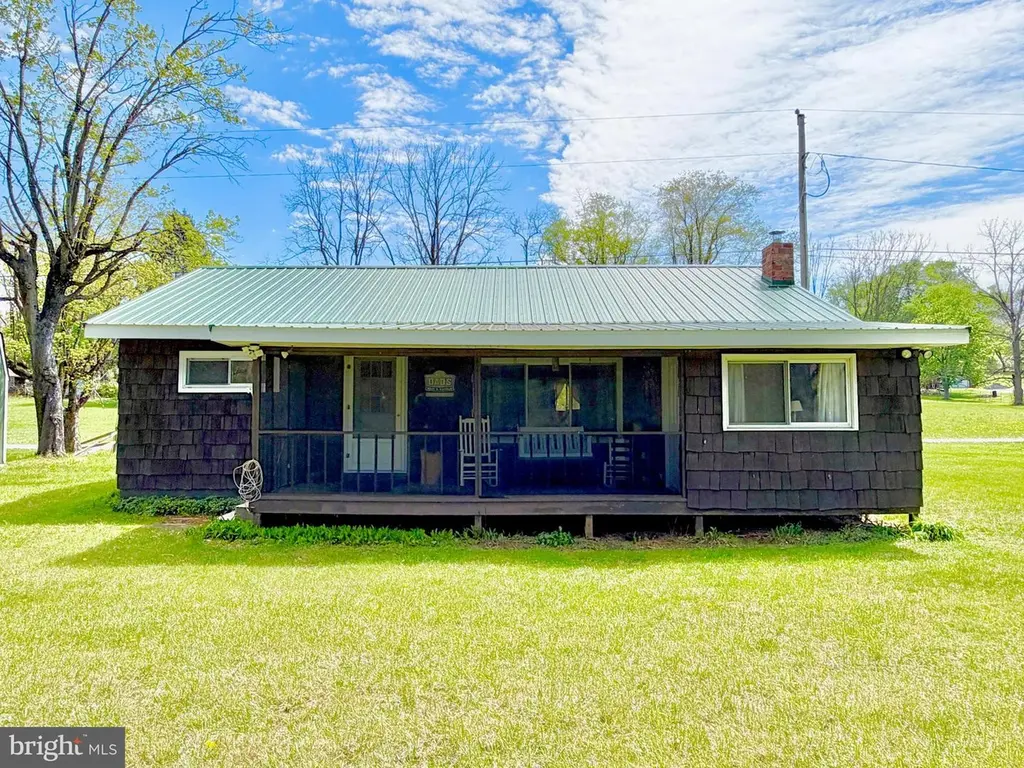
457 Cove St
Everett, PA 15537
$150,000C
3 bd · 1.0 ba ·
960 sqft ·
Built 1970
· SingleFamily
· Pending
· 5 DOM
Cashflow @ list (25.0% down · 7.5%)
Estimated rent
$1,387/mo
Mortgage (P&I)
−$787
Tax + insurance
−$568
HOA
−$8
Vac / Maint / Mgmt
−$291
Net cashflow
$-267/mo
Annual
$-3,200/yr
Cap rate
7.57%
Cash-on-cash
4.57%
DSCR
1.20
1% rule
0.92%
Cash to close
$42,000
Investor read
- This is a 3-bed/1.0-bath single-family listed at $150k.
- At list price, monthly cash flow is $-267 ($-3k/yr) — negative.
- To cash-flow at today's rent, offer at most $103k (31.4% below list).
- To meet the 1% rule (rent ≥ 1% of price), the offer needs to be $139k (7.5% below list).
- Only 5 days on market — expect competitive offers; lowballing is unlikely to land.
- Recommended offer: $103k (31.4% below list) — sets the bar for cash-flow.
- In year one you build about $16k of equity ($1k loan paydown + $15k appreciation (10.0% local appreciation)).
- Location reads 68/100 on livability (#906 in PA) — a middle-class / working-renter tenant base. Strengths: crime A+, cost of living A+, housing A; Watch: amenities F, commute F, employment F.
- Everett Area SD (rural): math 32% / reading 52% proficiency, ranked #337 of 539 in PA (top 62%) — families likely to look elsewhere, expect single-tenant / working-renter base with shorter leases.
- Zoned schools: Everett Area El Sch (math 31% / reading 53%, grade F, #883 of 1,518 statewide, top 61%, 435 students, 100% FRL); Everett Area Ms (math 18% / reading 48%, grade F, #346 of 512 statewide, top 69%, 293 students, 56% FRL); Everett Area Hs (math 72% / reading 75%, grade B+, #33 of 437 statewide, top 7%, 360 students, 35% FRL) — zoned schools average 64% FRL vs 46% district-wide (18 pts higher); higher-poverty schools than district average — tighter screening recommended.
- Watch-outs: flood insurance adds $427/mo.
- Market conditions: 62 active listings in the ZIP; 54 units permitted in Bedford County in 2024 (0 in 5+ unit buildings).
- Bedford County population projected at -25% by 2050 — secular population decline; favor cash flow + early exit over multi-decade hold.
- 3 sale attempts since 16y ago with the ask held roughly flat each time — persistent listings suggest the price (not the market) is what's stuck; bring a comps-based counter.
- Current owner paid $35k; list at $150k implies a 329% gain — meaningful room to come down on a strong offer.
- By year 3, paydown + projected appreciation supports a ~$41k cash-out refi (75% LTV) — recoverable capital for the next deal without selling this one.
- Climate carrying-cost: in FEMA flood zone AE (mandatory federal flood insurance) — expect insurance premiums to compound above CPI over the hold.
Questions for listing agent
- What do current leases actually rent for vs. the listed asking? Can we see a recent rent roll and the last 12 months of T-12 income?
- Built in 1970 — when were the roof, HVAC, electrical panel, plumbing, and water heater last replaced?
- What's the actual annual flood-insurance premium (NFIP or private), and is the property in a SFHA with mandatory coverage?
- What does the HOA fee cover, when was the last increase, and are there any pending special assessments or reserve-fund shortfalls?
- Is there a deadline driving the sale (1031 exchange, divorce, estate, relocation)? That informs how much negotiation room exists.
- What's the average days-on-market for RENTAL listings here right now (not sales)? A rising rental-DOM trend means longer vacancies and softer asking-rent achievability than the comps imply.
- What's the recent tenant-quality profile in this submarket — average credit score on applications, eviction rate, late-payment / NSF rate, and stable-employment percentage? A property-management company in the area should have these aggregated.
- How much new for-sale + rental construction is in the pipeline within 1–3 miles? Heavy new supply typically softens prices + rents 12–24 months out; constrained supply supports both.
CashFlowRE · CFR-1A14NV6VWAXPG9
· Data 3 weeks ago
cashflowre.app · 2026-05-29