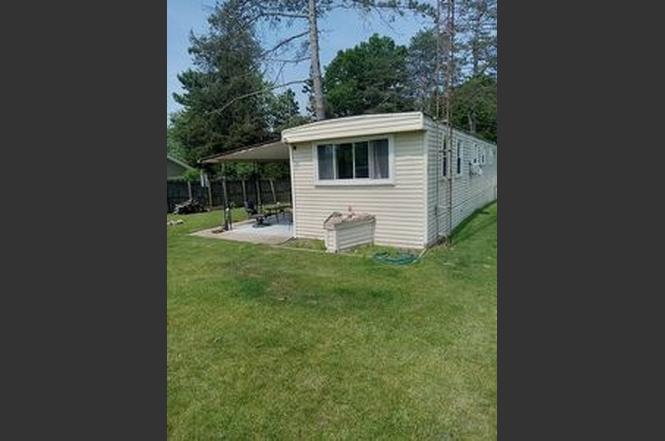
12337 Laird Rd
Cambridge, MI 49230
$53,400B-
3 bd · 1.0 ba ·
910 sqft ·
Built 1968
· Manufactured
· Active
· 31 DOM
Cashflow @ list (25.0% down · 7.5%)
Estimated rent
$1,194/mo
Mortgage (P&I)
−$280
Tax + insurance
−$89
HOA
−$0
Vac / Maint / Mgmt
−$251
Net cashflow
$574/mo
Annual
$6,893/yr
Cap rate
19.20%
Cash-on-cash
46.10%
DSCR
3.05
1% rule
2.24%
Cash to close
$14,952
Investor read
- This is a 3-bed/1.0-bath manufactured listed at $53k. Condition is rated good.
- At list price, monthly cash flow is $574 ($7k/yr) — positive.
- The deal already cash-flows at list — no discount required.
- Meets the 1% rule at list price ($1k rent vs $53k).
- It's been on market 31 days — a 3% lower offer ($52k) is reasonable based on typical stale-listing flexibility.
- Recommended offer: $52k (3.0% below list) — sets the bar for market timing.
- Local home prices are declining (-3.0%/yr); year-one equity from $369 of loan paydown is wiped out by about $2k of value loss. Plan a longer hold.
- Location reads: area grade B — affects rentability + tenant quality, not the cash-flow math above.
- Onsted Community Schools (rural): math 30% / reading 48% proficiency, ranked #210 of 540 in MI (top 39%) — families likely to look elsewhere, expect single-tenant / working-renter base with shorter leases.
- Zoned schools: Onsted Elementary (math 33% / reading 45%, grade F, #671 of 1,397 statewide, top 48%, 527 students, 50% FRL); Onsted Middle School (math 28% / reading 49%, grade F, #228 of 493 statewide, top 47%, 284 students, 45% FRL); Onsted Community High School (math 27% / reading 47%, grade F, #334 of 713 statewide, top 51%, 389 students, 42% FRL) — zoned schools average 46% FRL vs 30% district-wide (16 pts higher); higher-poverty schools than district average — tighter screening recommended.
- Market conditions: 141 active listings in the ZIP; 137 units permitted in Lenawee County in 2024 (0 in 5+ unit buildings).
- Lenawee County population projected at -18% by 2050 — secular population decline; favor cash flow + early exit over multi-decade hold.
- 2 sale attempts with the ask held roughly flat each time — persistent listings suggest the price (not the market) is what's stuck; bring a comps-based counter.
- At projected returns (-3.0% appreciation + 3.0% rent growth), your $15k cash investment doubles in ~3 years — after that, you're playing with house money.
Questions for listing agent
- It's been on market 31 days. Have you received any prior offers? Is the seller open to a 3% concession, seller financing, or rate buy-down credit?
- Built in 1968 — when were the roof, HVAC, electrical panel, plumbing, and water heater last replaced?
- Is there a deadline driving the sale (1031 exchange, divorce, estate, relocation)? That informs how much negotiation room exists.
- What's the average days-on-market for RENTAL listings here right now (not sales)? A rising rental-DOM trend means longer vacancies and softer asking-rent achievability than the comps imply.
- What's the recent tenant-quality profile in this submarket — average credit score on applications, eviction rate, late-payment / NSF rate, and stable-employment percentage? A property-management company in the area should have these aggregated.
- How much new for-sale + rental construction is in the pipeline within 1–3 miles? Heavy new supply typically softens prices + rents 12–24 months out; constrained supply supports both.
Repairs flagged (vision-AI assessment)
- Moderate: kitchen cabinets — dated and in need of updating
- Moderate: bathroom vanity — dated and in need of updating
- Major: kitchen appliances — outdated and in need of replacement
CashFlowRE · CFR-1DJ1JMD4PNKHE8
· Data 14 h ago
cashflowre.app · 2026-05-29