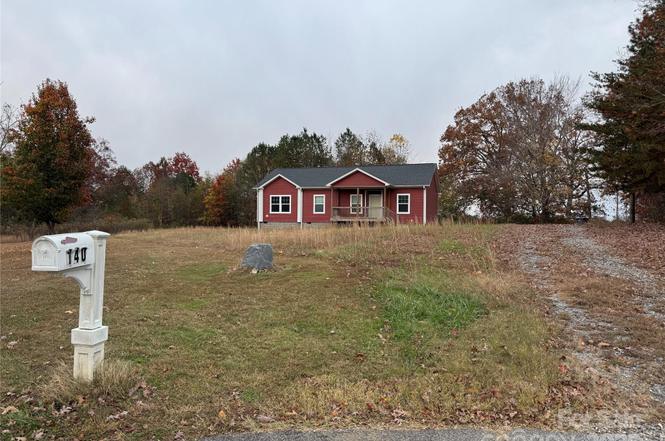
140 Silvermere Dr
Catawba, NC 28625
$94,000B
3 bd · 2.0 ba ·
1,550 sqft ·
Built 2020
· Manufactured
· Pending
· 1 DOM
Cashflow @ list (25.0% down · 7.5%)
Estimated rent
$1,909/mo
Mortgage (P&I)
−$493
Tax + insurance
−$166
HOA
−$0
Vac / Maint / Mgmt
−$401
Net cashflow
$849/mo
Annual
$10,190/yr
Cap rate
17.13%
Cash-on-cash
38.72%
DSCR
2.72
1% rule
2.03%
Cash to close
$26,320
Investor read
- This is a 3-bed/2.0-bath manufactured listed at $94k.
- At list price, monthly cash flow is $849 ($10k/yr) — positive.
- The deal already cash-flows at list — no discount required.
- Meets the 1% rule at list price ($2k rent vs $94k).
- Only 1 days on market — expect competitive offers; lowballing is unlikely to land.
- Local home prices are declining (-3.0%/yr); year-one equity from $650 of loan paydown is wiped out by about $3k of value loss. Plan a longer hold.
- Location reads 61/100 on livability (#494 in NC) — a middle-class / working-renter tenant base. Strengths: cost of living A+, housing A-, health & safety B; Watch: crime F, amenities F, commute F.
- Iredell-Statesville Schools (rural): math 53% / reading 52% proficiency, ranked #51 of 178 in NC (top 29%) — acceptable for families but not a draw, mixed tenant base, ~2y average lease.
- Zoned schools: Sharon Elementary (math 62% / reading 62%, grade B, #179 of 1,410 statewide, top 14%, 237 students, 61% FRL); West Iredell High (math 32% / reading 42%, grade F, #414 of 535 statewide, top 79%, 844 students, 61% FRL) — zoned schools average 61% FRL vs 38% district-wide (24 pts higher); higher-poverty schools than district average — tighter screening recommended.
- Market conditions: Rents rising (+2.7%/yr); 287 active listings in the ZIP; 1 comparable units currently listed for rent nearby; 1,955 units permitted in Iredell County in 2024 (128 in 5+ unit buildings).
- Iredell County population projected at +26% by 2050 — long-run rental-demand tailwind backs the buy-and-hold thesis.
- 5 sale attempts since 7y ago with the ask held roughly flat each time — persistent listings suggest the price (not the market) is what's stuck; bring a comps-based counter.
- Current owner paid $17k; list at $94k implies a 453% gain — meaningful room to come down on a strong offer.
- At projected returns (-3.0% appreciation + 2.7% rent growth), your $26k cash investment doubles in ~4 years — after that, you're playing with house money.
- Climate carrying-cost: extreme-heat days projected 7→18/yr by 2055 (HVAC capex compounding) — expect insurance premiums to compound above CPI over the hold.
- Cap rate 17.1% vs local median 3.9% in Catawba — top-decile yield for the area; either an underpriced asset or a hidden risk that comps aren't pricing in. Stress-test before assuming the spread holds.
- This rent runs 36% of the median local income ($64k/yr) — at the standard rent-burdened threshold; future hikes will face affordability resistance.
Questions for listing agent
- Is there a deadline driving the sale (1031 exchange, divorce, estate, relocation)? That informs how much negotiation room exists.
- Crime grade is F in this area — have there been break-ins, vandalism, or insurance claims at this property in the last 3 years? What carrier currently insures it and at what premium?
- What's the average days-on-market for RENTAL listings here right now (not sales)? A rising rental-DOM trend means longer vacancies and softer asking-rent achievability than the comps imply.
- What's the recent tenant-quality profile in this submarket — average credit score on applications, eviction rate, late-payment / NSF rate, and stable-employment percentage? A property-management company in the area should have these aggregated.
- How much new for-sale + rental construction is in the pipeline within 1–3 miles? Heavy new supply typically softens prices + rents 12–24 months out; constrained supply supports both.
CashFlowRE · CFR-1FN5SM04GHD30Z
· Data 6 days ago
cashflowre.app · 2026-05-29