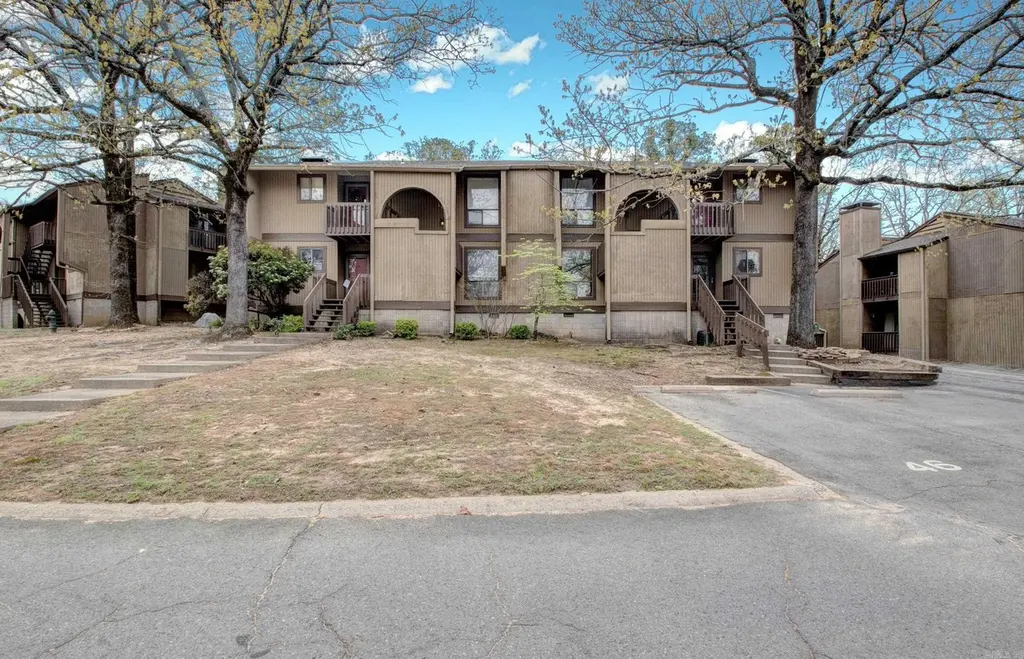
503 Green Mountain Cir #47
Little Rock, AR 72211
$69,900C-
2 bd · 2.0 ba ·
1,060 sqft ·
Built 1981
· SingleFamily
· Active
· 81 DOM
Cashflow @ list (25.0% down · 7.5%)
Estimated rent
$959/mo
Mortgage (P&I)
−$367
Tax + insurance
−$105
HOA
−$300
Vac / Maint / Mgmt
−$201
Net cashflow
$-14/mo
Annual
$-164/yr
Cap rate
6.06%
Cash-on-cash
-0.84%
DSCR
0.96
1% rule
1.37%
Cash to close
$19,572
Investor read
- This is a 2-bed/2.0-bath single-family listed at $70k.
- At list price, monthly cash flow is $-14 ($-164/yr) — negative.
- To cash-flow at today's rent, offer at most $67k (3.5% below list).
- Meets the 1% rule at list price ($959 rent vs $70k).
- It's been on market 81 days — a 6% lower offer ($66k) is reasonable based on typical stale-listing flexibility.
- Recommended offer: $66k (6.0% below list) — sets the bar for market timing.
- Local home prices are declining (-3.0%/yr); year-one equity from $483 of loan paydown is wiped out by about $2k of value loss. Plan a longer hold.
- Location reads 73/100 on livability (#22 in AR) — a middle-class / working-renter tenant base. Strengths: commute A+, cost of living A+, housing A+; Watch: crime F.
- Little Rock School District (urban): math 23% / reading 26% proficiency, ranked #183 of 238 in AR (top 77%) — low school quality limits family demand, transient renter base, plan for 1-2y turnover; 69% free/reduced lunch — lower-income household profile, screen leases tightly.
- Watch-outs: HOA is 31% of rent.
- Market conditions: Rents rising fast (+5.5%/yr); 87 active listings in the ZIP; 40 comparable units currently listed for rent nearby; rentals at typical pace (median 23d on market — plan ~3-4 weeks tenant-placement turnaround); 40% of comp listings sitting > 30 days — soft ceiling on asking rent; solid renter incomes; 1,006 units permitted in Pulaski County in 2024 (0 in 5+ unit buildings).
- Pulaski County population projected at +6% by 2050 — modest demand growth; plan on rents tracking national, not racing it.
- Climate carrying-cost: extreme-heat days projected 7→19/yr by 2055 (HVAC capex compounding) — expect insurance premiums to compound above CPI over the hold.
- Cap rate 6.1% vs local median 4.1% in Little Rock — top-decile yield for the area; either an underpriced asset or a hidden risk that comps aren't pricing in. Stress-test before assuming the spread holds.
- This rent is only 14% of the median local income ($83k/yr) — well below the 30% rent-burden line; pricing power to push rent on renewal without tenant pushback.
Questions for listing agent
- What do current leases actually rent for vs. the listed asking? Can we see a recent rent roll and the last 12 months of T-12 income?
- It's been on market 81 days. Have you received any prior offers? Is the seller open to a 6% concession, seller financing, or rate buy-down credit?
- What does the HOA fee cover, when was the last increase, and are there any pending special assessments or reserve-fund shortfalls?
- Why hasn't it sold? Are there any deal-killer items the seller is aware of (foundation, flood, title, zoning, code violations)?
- Is there a deadline driving the sale (1031 exchange, divorce, estate, relocation)? That informs how much negotiation room exists.
- Crime grade is F in this area — have there been break-ins, vandalism, or insurance claims at this property in the last 3 years? What carrier currently insures it and at what premium?
- What's the average days-on-market for RENTAL listings here right now (not sales)? A rising rental-DOM trend means longer vacancies and softer asking-rent achievability than the comps imply.
- What's the recent tenant-quality profile in this submarket — average credit score on applications, eviction rate, late-payment / NSF rate, and stable-employment percentage? A property-management company in the area should have these aggregated.
CashFlowRE · CFR-1FXARV3VBKRBQW
· Data 2 days ago
cashflowre.app · 2026-05-29