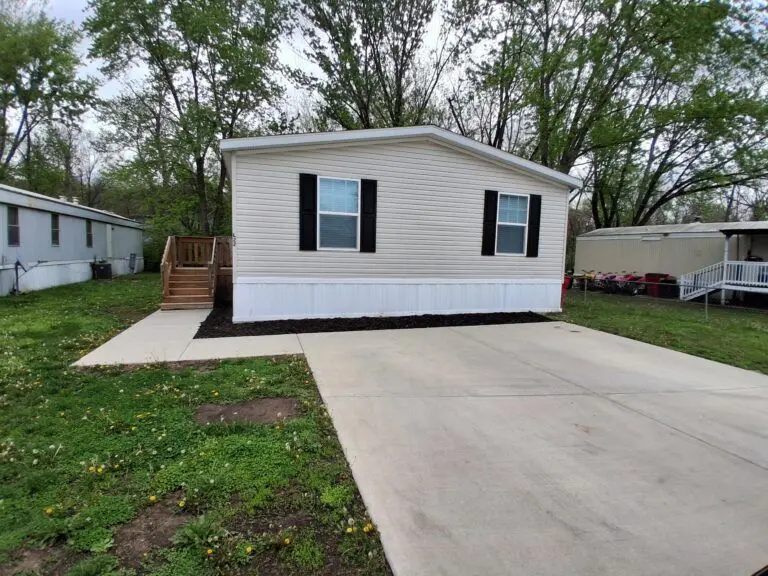
17311 E US Highway 40 Site Unit L22
Independence, MO 64055
$122,900B-
3 bd · 2.0 ba ·
1,344 sqft ·
Built 2026
· Manufactured
· Active
· 55 DOM
Cashflow @ list (25.0% down · 7.5%)
Estimated rent
$1,774/mo
Mortgage (P&I)
−$645
Tax + insurance
−$205
HOA
−$0
Vac / Maint / Mgmt
−$373
Net cashflow
$552/mo
Annual
$6,625/yr
Cap rate
11.68%
Cash-on-cash
19.25%
DSCR
1.86
1% rule
1.44%
Cash to close
$34,412
Investor read
- This is a 3-bed/2.0-bath manufactured listed at $123k. Condition is rated fair.
- At list price, monthly cash flow is $552 ($7k/yr) — positive.
- The deal already cash-flows at list — no discount required.
- Meets the 1% rule at list price ($2k rent vs $123k).
- It's been on market 55 days — a 3% lower offer ($119k) is reasonable based on typical stale-listing flexibility.
- Recommended offer: $119k (3.0% below list) — sets the bar for market timing.
- Local home prices are declining (-3.0%/yr); year-one equity from $850 of loan paydown is wiped out by about $4k of value loss. Plan a longer hold.
- Location reads 82/100 on livability (#10 in MO, #1,296 nationally) — a professional / high-income tenant draw. Strengths: amenities A+, commute A+, cost of living A+; Watch: schools C-, employment D+, crime F.
- Independence 30 (suburban): math 26% / reading 38% proficiency, ranked #252 of 324 in MO (top 78%) — families likely to look elsewhere, expect single-tenant / working-renter base with shorter leases.
- Market conditions: Rents rising fast (+5.1%/yr); 200 active listings in the ZIP; 13 comparable units currently listed for rent nearby; rentals leasing fast (median 13d on market — plan ~1-2 weeks tenant-placement turnaround); 4,002 units permitted in Jackson County in 2024 (2,271 in 5+ unit buildings).
- Jackson County population projected at +4% by 2050 — modest demand growth; plan on rents tracking national, not racing it.
- 3 sale attempts with the ask held roughly flat each time — persistent listings suggest the price (not the market) is what's stuck; bring a comps-based counter.
- At projected returns (-3.0% appreciation + 5.1% rent growth), your $34k cash investment doubles in ~6 years — after that, you're playing with house money.
- Cap rate 11.7% vs local median 5.0% in Independence — top-decile yield for the area; either an underpriced asset or a hidden risk that comps aren't pricing in. Stress-test before assuming the spread holds.
- This rent runs 34% of the median local income ($62k/yr) — at the standard rent-burdened threshold; future hikes will face affordability resistance.
Questions for listing agent
- It's been on market 55 days. Have you received any prior offers? Is the seller open to a 3% concession, seller financing, or rate buy-down credit?
- Have any recent inspections been done? Can we get a copy of the seller's disclosures and any deferred-maintenance estimates?
- Is there a deadline driving the sale (1031 exchange, divorce, estate, relocation)? That informs how much negotiation room exists.
- Crime grade is F in this area — have there been break-ins, vandalism, or insurance claims at this property in the last 3 years? What carrier currently insures it and at what premium?
- What's the average days-on-market for RENTAL listings here right now (not sales)? A rising rental-DOM trend means longer vacancies and softer asking-rent achievability than the comps imply.
- What's the recent tenant-quality profile in this submarket — average credit score on applications, eviction rate, late-payment / NSF rate, and stable-employment percentage? A property-management company in the area should have these aggregated.
- How much new for-sale + rental construction is in the pipeline within 1–3 miles? Heavy new supply typically softens prices + rents 12–24 months out; constrained supply supports both.
Repairs flagged (vision-AI assessment)
- Minor: Paint exterior siding — Slight discoloration
- Minor: Trim and paint exterior trim — Weathered appearance
CashFlowRE · CFR-1H7S6K7HCGSX87
· Data 1 week ago
cashflowre.app · 2026-05-29