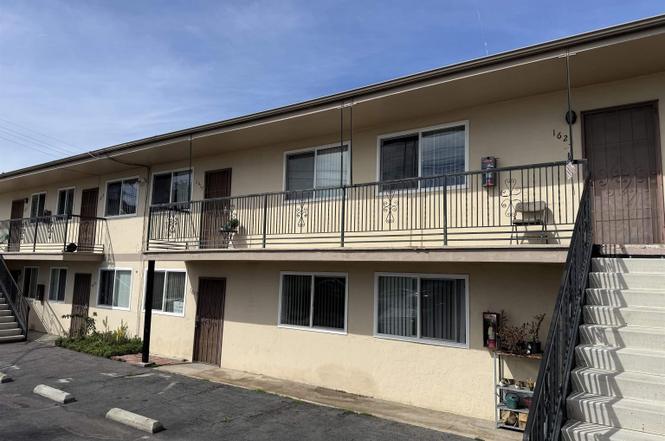
1609 E 10th St
National City, CA 91950
$1,975,000B-
12 bd · 8.0 ba ·
4,894 sqft ·
Built 1961
· MultiFamily
· Active
· 84 DOM
Cashflow @ list (25.0% down · 7.5%)
Estimated rent
$25,929/mo
Mortgage (P&I)
−$10,357
Tax + insurance
−$2,418
HOA
−$0
Vac / Maint / Mgmt
−$5,445
Net cashflow
$7,709/mo
Annual
$92,503/yr
Cap rate
10.98%
Cash-on-cash
16.73%
DSCR
1.74
1% rule
1.31%
Cash to close
$553,000
Investor read
- This is a 8 × 12-bed/1.0-bath units multifamily listed at $1.98M.
- At list price, monthly cash flow is $8k ($93k/yr) — positive. Per door: $964/mo.
- The deal already cash-flows at list — no discount required.
- Meets the 1% rule at list price ($26k rent vs $1.98M).
- It's been on market 84 days — a 6% lower offer ($1.86M) is reasonable based on typical stale-listing flexibility.
- Recommended offer: $1.86M (6.0% below list) — sets the bar for market timing.
- Local home prices are declining (-3.0%/yr); year-one equity from $14k of loan paydown is wiped out by about $59k of value loss. Plan a longer hold.
- Location reads 64/100 on livability (#430 in CA) — a middle-class / working-renter tenant base. Strengths: commute A+; Watch: schools D, crime F, cost of living F.
- Sweetwater Union High (suburban): math 36% / reading 52% proficiency, ranked #187 of 517 in CA (top 36%) — families likely to look elsewhere, expect single-tenant / working-renter base with shorter leases.
- Market conditions: Rents rising (+2.8%/yr); 55 active listings in the ZIP; 11,759 units permitted in San Diego County in 2024 (7,244 in 5+ unit buildings).
- San Diego County population projected at +20% by 2050 — long-run rental-demand tailwind backs the buy-and-hold thesis.
- 3 sale attempts with the ask held roughly flat each time — persistent listings suggest the price (not the market) is what's stuck; bring a comps-based counter.
- Current owner paid $1.07M; list at $1.98M implies a 84% gain — meaningful room to come down on a strong offer.
- At projected returns (-3.0% appreciation + 2.8% rent growth), your $553k cash investment doubles in ~8 years — after that, you're playing with house money.
- Cap rate 11.0% vs local median 3.1% in National City — top-decile yield for the area; either an underpriced asset or a hidden risk that comps aren't pricing in. Stress-test before assuming the spread holds.
- At $25,929/mo this rent would consume 468% of the median local household income ($66k/yr) (locally 3672% of renters already pay >50% of income on rent) — very limited rent-growth headroom before tenants either downsize or default.
Questions for listing agent
- It's been on market 84 days. Have you received any prior offers? Is the seller open to a 6% concession, seller financing, or rate buy-down credit?
- Can we see the unit-by-unit rent roll, current vacancy, and any below-market leases? What's the average tenancy length?
- What capital expenditures (roof, boiler, parking lot, exteriors) have been made in the last 5 years, and what's planned in the next 2?
- Built in 1961 — when were the roof, HVAC, electrical panel, plumbing, and water heater last replaced?
- Why hasn't it sold? Are there any deal-killer items the seller is aware of (foundation, flood, title, zoning, code violations)?
- Is there a deadline driving the sale (1031 exchange, divorce, estate, relocation)? That informs how much negotiation room exists.
- Schools are D-rated, which usually means shorter tenancies and higher turnover. Who's the typical renter profile here, and what's been the actual vacancy rate?
- Crime grade is F in this area — have there been break-ins, vandalism, or insurance claims at this property in the last 3 years? What carrier currently insures it and at what premium?
CashFlowRE · CFR-1MM5BP1BSNT8AJ
· Data 4 h ago
cashflowre.app · 2026-05-29