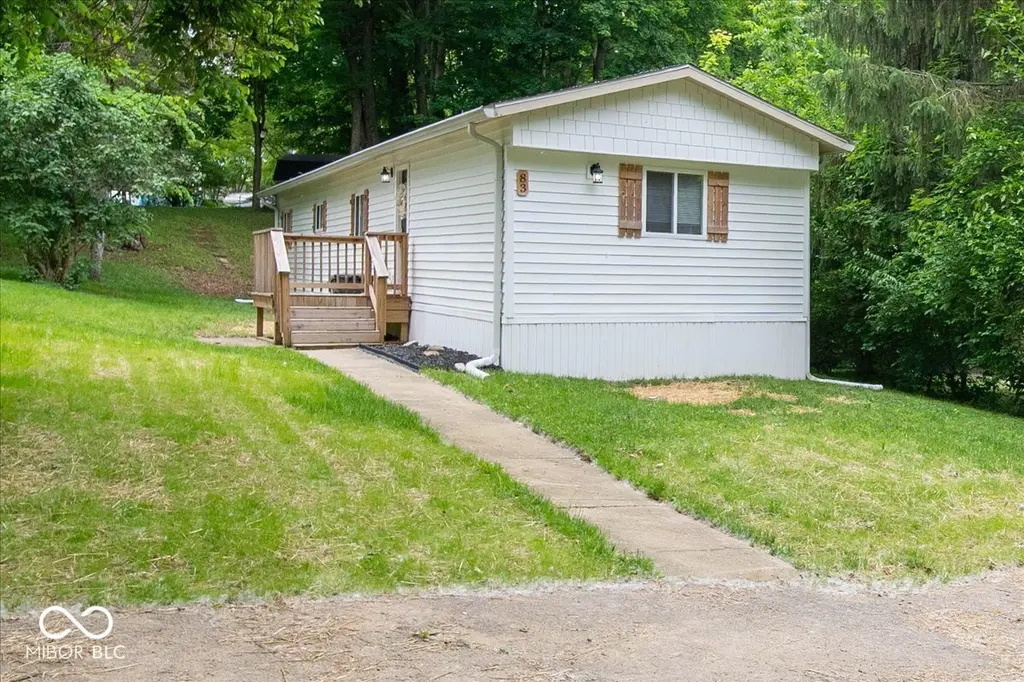
83 Ravine Ct
Cicero, IN 46034
$189,900C-
3 bd · 1.5 ba ·
896 sqft ·
Built 1980
· Manufactured
· Active
· 22 DOM
Cashflow @ list (25.0% down · 7.5%)
Estimated rent
$1,740/mo
Mortgage (P&I)
−$996
Tax + insurance
−$185
HOA
−$0
Vac / Maint / Mgmt
−$365
Net cashflow
$193/mo
Annual
$2,318/yr
Cap rate
7.93%
Cash-on-cash
5.86%
DSCR
1.26
1% rule
0.92%
Cash to close
$53,172
Investor read
- This is a 3-bed/1.5-bath manufactured listed at $190k.
- At list price, monthly cash flow is $193 ($2k/yr) — positive.
- The deal already cash-flows at list — no discount required.
- To meet the 1% rule (rent ≥ 1% of price), the offer needs to be $174k (8.4% below list).
- It's been on market 22 days — a 2% lower offer ($187k) is reasonable based on typical stale-listing flexibility.
- Recommended offer: $174k (8.4% below list) — sets the bar for 1% rule.
- Local home prices are declining (-3.0%/yr); year-one equity from $1k of loan paydown is wiped out by about $6k of value loss. Plan a longer hold.
- Location reads 67/100 on livability (#242 in IN) — a middle-class / working-renter tenant base. Strengths: crime A+, cost of living A+, housing A+; Watch: amenities F, commute F, health & safety F.
- Hamilton Heights School Corporation (suburban): math 31% / reading 44% proficiency, ranked #154 of 301 in IN (top 51%) — families likely to look elsewhere, expect single-tenant / working-renter base with shorter leases.
- Zoned schools: Hamilton Heights Elementary School (math 40% / reading 39%, grade F, #500 of 994 statewide, top 53%, 901 students, 33% FRL); Hamilton Heights High School (math 32% / reading 67%, grade D, #123 of 369 statewide, top 36%, 711 students, 31% FRL).
- Watch-outs: flood insurance adds $66/mo.
- Market conditions: 69 active listings in the ZIP; 1 comparable units currently listed for rent nearby; solid renter incomes; 4,661 units permitted in Hamilton County in 2024 (1,528 in 5+ unit buildings).
- Hamilton County population projected at +44% by 2050 — long-run rental-demand tailwind backs the buy-and-hold thesis.
- 3 sale attempts since 4y ago with the ask held roughly flat each time — persistent listings suggest the price (not the market) is what's stuck; bring a comps-based counter.
- Climate carrying-cost: severe flood risk — expect insurance premiums to compound above CPI over the hold.
- Cap rate 7.9% vs local median 2.9% in Cicero — top-decile yield for the area; either an underpriced asset or a hidden risk that comps aren't pricing in. Stress-test before assuming the spread holds.
Questions for listing agent
- What's the actual annual flood-insurance premium (NFIP or private), and is the property in a SFHA with mandatory coverage?
- Is there a deadline driving the sale (1031 exchange, divorce, estate, relocation)? That informs how much negotiation room exists.
- Schools are D-rated, which usually means shorter tenancies and higher turnover. Who's the typical renter profile here, and what's been the actual vacancy rate?
- What's the average days-on-market for RENTAL listings here right now (not sales)? A rising rental-DOM trend means longer vacancies and softer asking-rent achievability than the comps imply.
- What's the recent tenant-quality profile in this submarket — average credit score on applications, eviction rate, late-payment / NSF rate, and stable-employment percentage? A property-management company in the area should have these aggregated.
- How much new for-sale + rental construction is in the pipeline within 1–3 miles? Heavy new supply typically softens prices + rents 12–24 months out; constrained supply supports both.
CashFlowRE · CFR-1P6XVS851PP7WN
· Data 2 days ago
cashflowre.app · 2026-05-29