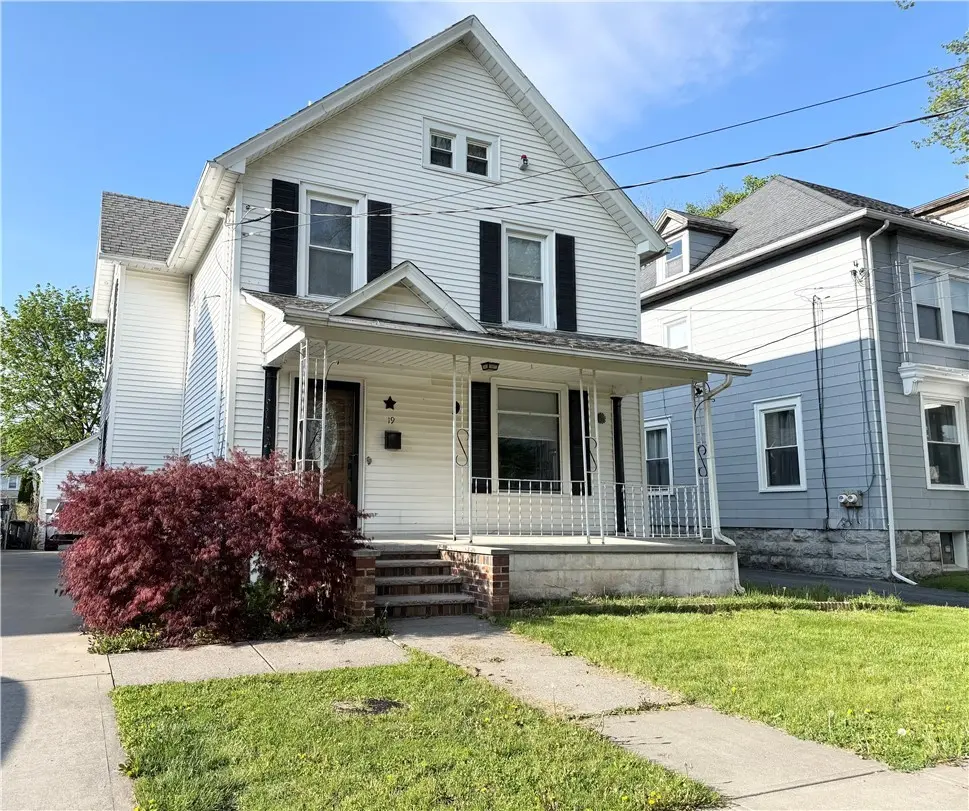
19 Cady St
Auburn, NY 13021
$205,000D
4 bd · 2.5 ba ·
1,960 sqft ·
Built 1890
· SingleFamily
· Active
· 33 DOM
Cashflow @ list (25.0% down · 7.5%)
Estimated rent
$1,821/mo
Mortgage (P&I)
−$1,075
Tax + insurance
−$300
HOA
−$0
Vac / Maint / Mgmt
−$382
Net cashflow
$64/mo
Annual
$765/yr
Cap rate
6.67%
Cash-on-cash
1.33%
DSCR
1.06
1% rule
0.89%
Cash to close
$57,400
Investor read
- This is a 4-bed/2.5-bath single-family listed at $205k.
- At list price, monthly cash flow is $64 ($765/yr) — positive.
- The deal already cash-flows at list — no discount required.
- To meet the 1% rule (rent ≥ 1% of price), the offer needs to be $182k (11.2% below list).
- It's been on market 33 days — a 3% lower offer ($199k) is reasonable based on typical stale-listing flexibility.
- Recommended offer: $182k (11.2% below list) — sets the bar for 1% rule.
- Local home prices are declining (-3.0%/yr); year-one equity from $1k of loan paydown is wiped out by about $6k of value loss. Plan a longer hold.
- Location reads 74/100 on livability (#298 in NY, #4,814 nationally) — a middle-class / working-renter tenant base. Strengths: cost of living A+, housing A+, health & safety A+; Watch: amenities D-, commute F, employment D-.
- Auburn City School District (town): math 31% / reading 39% proficiency, ranked #558 of 590 in NY (top 95%) — families likely to look elsewhere, expect single-tenant / working-renter base with shorter leases.
- Zoned schools: Herman Avenue Elementary School (math 21% / reading 35%, grade F, #1,774 of 2,108 statewide, top 84%, 444 students, 51% FRL); Auburn Junior High School (math 16% / reading 26%, grade F, #661 of 729 statewide, top 91%, 598 students, 81% FRL); Auburn High School (math 88% / reading 84%, grade A, #347 of 1,100 statewide, top 32%, 1,183 students, 51% FRL) — zoned schools average 61% FRL vs 42% district-wide (19 pts higher); higher-poverty schools than district average — tighter screening recommended.
- Watch-outs: built in 1890 — expect roof / HVAC / electrical / plumbing capex.
- Market conditions: 221 active listings in the ZIP; 2 comparable units currently listed for rent nearby; 161 units permitted in Cayuga County in 2024 (65 in 5+ unit buildings).
- Cayuga County population projected at -18% by 2050 — secular population decline; favor cash flow + early exit over multi-decade hold.
- 5 sale attempts since 7y ago with the ask held roughly flat each time — persistent listings suggest the price (not the market) is what's stuck; bring a comps-based counter.
- This rent runs 36% of the median local income ($61k/yr) — at the standard rent-burdened threshold; future hikes will face affordability resistance.
Questions for listing agent
- It's been on market 33 days. Have you received any prior offers? Is the seller open to a 11% concession, seller financing, or rate buy-down credit?
- Built in 1890 — when were the roof, HVAC, electrical panel, plumbing, and water heater last replaced?
- Is there a deadline driving the sale (1031 exchange, divorce, estate, relocation)? That informs how much negotiation room exists.
- Schools are D-rated, which usually means shorter tenancies and higher turnover. Who's the typical renter profile here, and what's been the actual vacancy rate?
- The area grade is low — what's the realistic commute time and amenity access for the typical tenant pool here? Any planned neighborhood developments (good or bad) we should know about?
- What's the average days-on-market for RENTAL listings here right now (not sales)? A rising rental-DOM trend means longer vacancies and softer asking-rent achievability than the comps imply.
- What's the recent tenant-quality profile in this submarket — average credit score on applications, eviction rate, late-payment / NSF rate, and stable-employment percentage? A property-management company in the area should have these aggregated.
- How much new for-sale + rental construction is in the pipeline within 1–3 miles? Heavy new supply typically softens prices + rents 12–24 months out; constrained supply supports both.
CashFlowRE · CFR-1QBT7K5569EJZ0
· Data 2 days ago
cashflowre.app · 2026-05-29