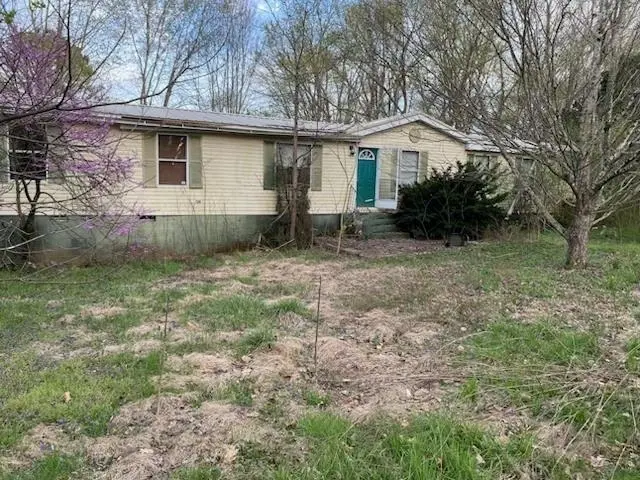
310 Lavender Rd
Smiths Grove, KY 42171
$79,900B-
4 bd · 2.0 ba ·
2,128 sqft ·
Built 1994
· Manufactured
· Active
· 86 DOM
Cashflow @ list (25.0% down · 7.5%)
Estimated rent
$1,381/mo
Mortgage (P&I)
−$419
Tax + insurance
−$174
HOA
−$0
Vac / Maint / Mgmt
−$290
Net cashflow
$499/mo
Annual
$5,983/yr
Cap rate
14.78%
Cash-on-cash
30.31%
DSCR
2.35
1% rule
1.73%
Cash to close
$22,372
Investor read
- This is a 4-bed/2.0-bath manufactured listed at $80k.
- At list price, monthly cash flow is $499 ($6k/yr) — positive.
- The deal already cash-flows at list — no discount required.
- Meets the 1% rule at list price ($1k rent vs $80k).
- It's been on market 86 days — a 6% lower offer ($75k) is reasonable based on typical stale-listing flexibility.
- Recommended offer: $75k (6.0% below list) — sets the bar for market timing.
- Local home prices are declining (-3.0%/yr); year-one equity from $552 of loan paydown is wiped out by about $2k of value loss. Plan a longer hold.
- Location reads 65/100 on livability (#256 in KY) — a middle-class / working-renter tenant base. Strengths: cost of living A+, housing A+; Watch: employment D, crime F, amenities F.
- Edmonson County (rural): math 31% / reading 43% proficiency, ranked #53 of 165 in KY (top 32%) — families likely to look elsewhere, expect single-tenant / working-renter base with shorter leases.
- Zoned schools: South Edmonson Elementary School (math 27% / reading 42%, grade F, #301 of 676 statewide, top 48%, 464 students, 37% FRL); Edmonson County 5/6 Center (math 22% / reading 38%, grade F, #146 of 217 statewide, top 69%, 253 students, 52% FRL); Edmonson County High School (math 22% / reading 42%, grade F, #97 of 254 statewide, top 46%, 592 students, 54% FRL) — zoned schools at 48% FRL track the district average.
- Watch-outs: flood insurance adds $66/mo.
- Market conditions: 79 active listings in the ZIP.
- Edmonson County population projected at -16% by 2050 — secular population decline; favor cash flow + early exit over multi-decade hold.
- Current owner paid $7k; list at $80k implies a 1041% gain — meaningful room to come down on a strong offer.
- At projected returns (-3.0% appreciation + 3.0% rent growth), your $22k cash investment doubles in ~5 years — after that, you're playing with house money.
- Climate carrying-cost: severe flood risk; extreme-heat days projected 7→19/yr by 2055 (HVAC capex compounding) — expect insurance premiums to compound above CPI over the hold.
- Cap rate 14.8% vs local median 2.4% in Smiths Grove — top-decile yield for the area; either an underpriced asset or a hidden risk that comps aren't pricing in. Stress-test before assuming the spread holds.
Questions for listing agent
- It's been on market 86 days. Have you received any prior offers? Is the seller open to a 6% concession, seller financing, or rate buy-down credit?
- What's the actual annual flood-insurance premium (NFIP or private), and is the property in a SFHA with mandatory coverage?
- Why hasn't it sold? Are there any deal-killer items the seller is aware of (foundation, flood, title, zoning, code violations)?
- Is there a deadline driving the sale (1031 exchange, divorce, estate, relocation)? That informs how much negotiation room exists.
- Crime grade is F in this area — have there been break-ins, vandalism, or insurance claims at this property in the last 3 years? What carrier currently insures it and at what premium?
- What's the average days-on-market for RENTAL listings here right now (not sales)? A rising rental-DOM trend means longer vacancies and softer asking-rent achievability than the comps imply.
- What's the recent tenant-quality profile in this submarket — average credit score on applications, eviction rate, late-payment / NSF rate, and stable-employment percentage? A property-management company in the area should have these aggregated.
- How much new for-sale + rental construction is in the pipeline within 1–3 miles? Heavy new supply typically softens prices + rents 12–24 months out; constrained supply supports both.
CashFlowRE · CFR-1QZNSRD13WW12W
· Data 1 day ago
cashflowre.app · 2026-05-29