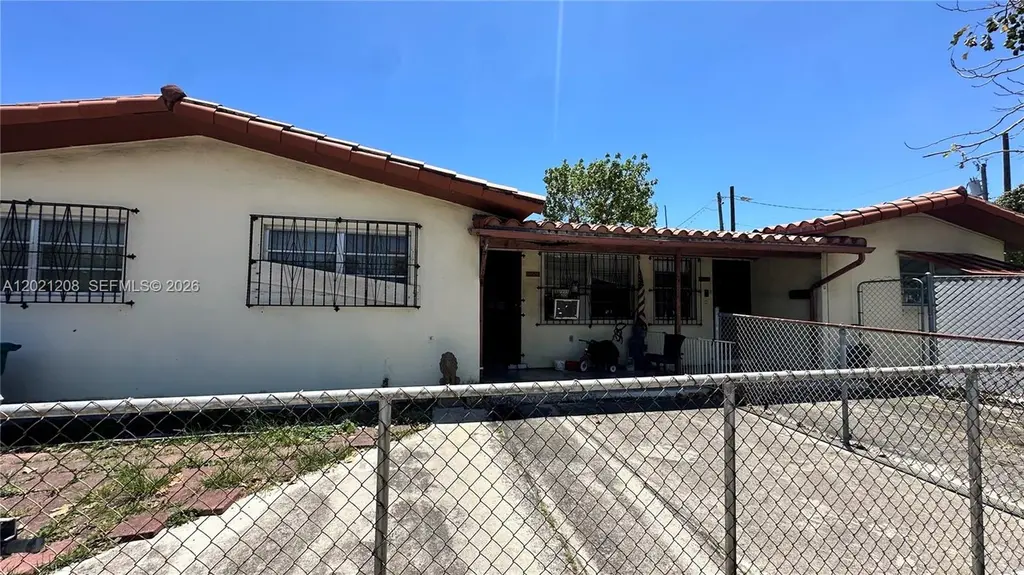
1050 SW 10th St
Miami, FL 33130
$750,000D
6 bd · 4.0 ba ·
2,408 sqft ·
Built 1979
· MultiFamily
· Pending
· 3 DOM
Cashflow @ list (25.0% down · 7.5%)
Estimated rent
$5,770/mo
Mortgage (P&I)
−$3,933
Tax + insurance
−$996
HOA
−$0
Vac / Maint / Mgmt
−$1,212
Net cashflow
$-371/mo
Annual
$-4,446/yr
Cap rate
5.70%
Cash-on-cash
-2.12%
DSCR
0.91
1% rule
0.77%
Cash to close
$210,000
Investor read
- This is a 6-bed/4.0-bath multifamily listed at $750k.
- At list price, monthly cash flow is $-371 ($-4k/yr) — negative.
- To cash-flow at today's rent, offer at most $685k (8.7% below list).
- To meet the 1% rule (rent ≥ 1% of price), the offer needs to be $577k (23.1% below list).
- Only 3 days on market — expect competitive offers; lowballing is unlikely to land.
- Recommended offer: $577k (23.1% below list) — sets the bar for 1% rule.
- Local home prices are declining (-1.8%/yr); year-one equity from $5k of loan paydown is wiped out by about $13k of value loss. Plan a longer hold.
- Location reads 78/100 on livability (#177 in FL, #2,724 nationally) — a middle-class / working-renter tenant base. Strengths: amenities A+, commute A+, health & safety A+; Watch: employment C-, crime F, cost of living F.
- Miami-Dade (suburban): math 45% / reading 54% proficiency, ranked #40 of 73 in FL (top 55%) — families likely to look elsewhere, expect single-tenant / working-renter base with shorter leases; 64% free/reduced lunch — lower-income household profile, screen leases tightly.
- Market conditions: Rents soft (-0.5%/yr); 639 active listings in the ZIP; 3 comparable units currently listed for rent nearby; rentals leasing fast (median 11d on market — plan ~1-2 weeks tenant-placement turnaround); 10,051 units permitted in Miami-Dade County in 2024 (7,758 in 5+ unit buildings).
- Miami-Dade County population projected at +28% by 2050 — long-run rental-demand tailwind backs the buy-and-hold thesis.
- Current owner paid $116k; list at $750k implies a 547% gain — meaningful room to come down on a strong offer.
- Climate carrying-cost: severe wind risk, 99% chance of damaging wind over 30y; extreme-heat days projected 8→32/yr by 2055 (HVAC capex compounding) — expect insurance premiums to compound above CPI over the hold.
- Cap rate 5.7% vs local median 1.9% in Miami — top-decile yield for the area; either an underpriced asset or a hidden risk that comps aren't pricing in. Stress-test before assuming the spread holds.
- At $5,770/mo this rent would consume 113% of the median local household income ($61k/yr) (locally 5231% of renters already pay >50% of income on rent) — very limited rent-growth headroom before tenants either downsize or default.
Questions for listing agent
- What do current leases actually rent for vs. the listed asking? Can we see a recent rent roll and the last 12 months of T-12 income?
- Built in 1979 — when were the roof, HVAC, electrical panel, plumbing, and water heater last replaced?
- Is there a deadline driving the sale (1031 exchange, divorce, estate, relocation)? That informs how much negotiation room exists.
- Schools are B-rated — typically a magnet for longer-tenancy family renters. What's the average tenant stay here, and is there a school-zone premium baked into asking?
- Crime grade is F in this area — have there been break-ins, vandalism, or insurance claims at this property in the last 3 years? What carrier currently insures it and at what premium?
- The area grade is low — what's the realistic commute time and amenity access for the typical tenant pool here? Any planned neighborhood developments (good or bad) we should know about?
- What's the average days-on-market for RENTAL listings here right now (not sales)? A rising rental-DOM trend means longer vacancies and softer asking-rent achievability than the comps imply.
- What's the recent tenant-quality profile in this submarket — average credit score on applications, eviction rate, late-payment / NSF rate, and stable-employment percentage? A property-management company in the area should have these aggregated.
CashFlowRE · CFR-1SWP0X77ZFEQTD
· Data 3 weeks ago
cashflowre.app · 2026-05-29