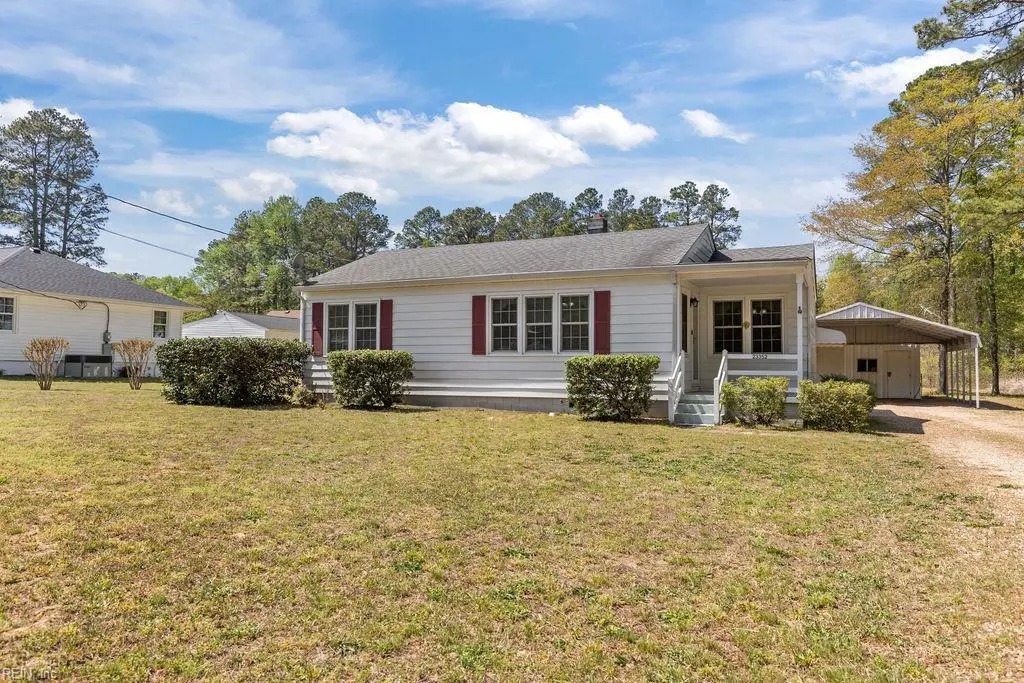
23352 Grant St
Courtland, VA 23837
$205,000D
2 bd · 1.0 ba ·
936 sqft ·
Built 1956
· SingleFamily
· Active
· 67 DOM
Cashflow @ list (25.0% down · 7.5%)
Estimated rent
$922/mo
Mortgage (P&I)
−$1,075
Tax + insurance
−$184
HOA
−$0
Vac / Maint / Mgmt
−$194
Net cashflow
$-531/mo
Annual
$-6,372/yr
Cap rate
3.18%
Cash-on-cash
-11.10%
DSCR
0.51
1% rule
0.45%
Cash to close
$57,400
Investor read
- This is a 2-bed/1.0-bath single-family listed at $205k.
- At list price, monthly cash flow is $-531 ($-6k/yr) — negative.
- To cash-flow at today's rent, offer at most $111k (45.8% below list).
- To meet the 1% rule (rent ≥ 1% of price), the offer needs to be $92k (55.0% below list).
- It's been on market 67 days — a 6% lower offer ($193k) is reasonable based on typical stale-listing flexibility.
- Recommended offer: $92k (55.0% below list) — sets the bar for 1% rule.
- In year one you build about $22k of equity ($1k loan paydown + $20k appreciation (10.0% local appreciation)).
- Location reads 72/100 on livability (#186 in VA) — a middle-class / working-renter tenant base. Strengths: crime A+, cost of living A+, housing A+; Watch: employment C-, amenities F, commute F.
- Southampton County Public School District (rural): math 43% / reading 66% proficiency, ranked #85 of 131 in VA (top 65%) — acceptable for families but not a draw, mixed tenant base, ~2y average lease.
- Zoned schools: Southampton Middle (math 31% / reading 56%, grade D, #285 of 342 statewide, top 84%, 566 students, 76% FRL); Southampton High (math 47% / reading 77%, grade B-, #231 of 319 statewide, top 75%, 769 students, 75% FRL) — zoned schools average 75% FRL vs 41% district-wide (35 pts higher); higher-poverty schools than district average — tighter screening recommended.
- Watch-outs: built in 1956 — expect roof / HVAC / electrical / plumbing capex.
- Market conditions: 42 active listings in the ZIP; 60 units permitted in Southampton County in 2024 (0 in 5+ unit buildings).
- Southampton County population projected at -18% by 2050 — secular population decline; favor cash flow + early exit over multi-decade hold.
- By year 2, paydown + projected appreciation supports a ~$35k cash-out refi (75% LTV) — recoverable capital for the next deal without selling this one.
- Cap rate 3.2% vs local median 1.8% in Courtland — top-decile yield for the area; either an underpriced asset or a hidden risk that comps aren't pricing in. Stress-test before assuming the spread holds.
Questions for listing agent
- What do current leases actually rent for vs. the listed asking? Can we see a recent rent roll and the last 12 months of T-12 income?
- It's been on market 67 days. Have you received any prior offers? Is the seller open to a 55% concession, seller financing, or rate buy-down credit?
- Built in 1956 — when were the roof, HVAC, electrical panel, plumbing, and water heater last replaced?
- Why hasn't it sold? Are there any deal-killer items the seller is aware of (foundation, flood, title, zoning, code violations)?
- Is there a deadline driving the sale (1031 exchange, divorce, estate, relocation)? That informs how much negotiation room exists.
- Schools are A-rated — typically a magnet for longer-tenancy family renters. What's the average tenant stay here, and is there a school-zone premium baked into asking?
- The area grade is low — what's the realistic commute time and amenity access for the typical tenant pool here? Any planned neighborhood developments (good or bad) we should know about?
- What's the average days-on-market for RENTAL listings here right now (not sales)? A rising rental-DOM trend means longer vacancies and softer asking-rent achievability than the comps imply.
CashFlowRE · CFR-1V8MK119D5AMHD
· Data 2 h ago
cashflowre.app · 2026-05-29