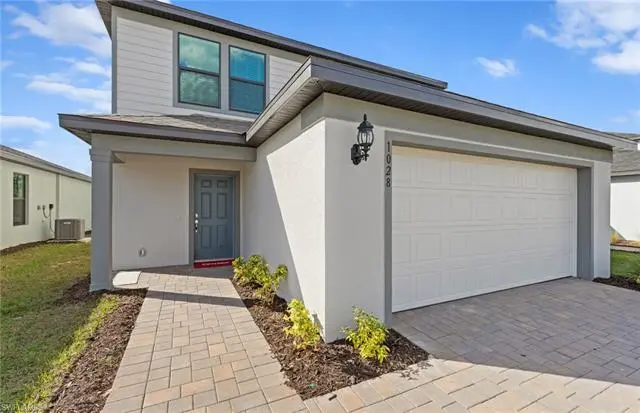
1028 Caloosa Breeze Dr
LaBelle, FL 33935
$340,000D-
4 bd · 3.0 ba ·
2,203 sqft ·
Built 2026
· Land
· Pending
· 55 DOM
Cashflow @ list (25.0% down · 7.5%)
Estimated rent
$2,264/mo
Mortgage (P&I)
−$1,783
Tax + insurance
−$567
HOA
−$103
Vac / Maint / Mgmt
−$475
Net cashflow
$-664/mo
Annual
$-7,970/yr
Cap rate
3.95%
Cash-on-cash
-8.37%
DSCR
0.63
1% rule
0.67%
Cash to close
$95,200
Investor read
- This is a 4-bed/3.0-bath land listed at $340k.
- At list price, monthly cash flow is $-664 ($-8k/yr) — negative.
- To cash-flow at today's rent, offer at most $244k (28.3% below list).
- To meet the 1% rule (rent ≥ 1% of price), the offer needs to be $226k (33.4% below list).
- It's been on market 55 days — a 3% lower offer ($330k) is reasonable based on typical stale-listing flexibility.
- Recommended offer: $226k (33.4% below list) — sets the bar for 1% rule.
- In year one you build about $36k of equity ($2k loan paydown + $34k appreciation (10.0% local appreciation)).
- Location reads 72/100 on livability (#324 in FL) — a middle-class / working-renter tenant base. Strengths: cost of living A+, housing A+, health & safety A+; Watch: commute F, employment F.
- Hendry (town): math 35% / reading 40% proficiency, ranked #65 of 73 in FL (top 89%) — families likely to look elsewhere, expect single-tenant / working-renter base with shorter leases; 75% free/reduced lunch — lower-income household profile, screen leases tightly.
- Zoned schools: Labelle Elementary School (math 37% / reading 37%, grade F, #1,609 of 2,144 statewide, top 77%, 437 students, 77% FRL); Labelle High School (math 42% / reading 41%, grade F, #284 of 667 statewide, top 43%, 1,451 students, 62% FRL).
- Market conditions: 942 active listings in the ZIP; 1 comparable units currently listed for rent nearby; 557 units permitted in Hendry County in 2024 (45 in 5+ unit buildings).
- Hendry County population projected to shrink 7% by 2050 — rents likely to lag national; underwrite the cash flow, not the appreciation.
- By year 2, paydown + projected appreciation supports a ~$58k cash-out refi (75% LTV) — recoverable capital for the next deal without selling this one.
- At $2,264/mo this rent would consume 48% of the median local household income ($57k/yr) (locally 498% of renters already pay >50% of income on rent) — very limited rent-growth headroom before tenants either downsize or default.
Questions for listing agent
- What do current leases actually rent for vs. the listed asking? Can we see a recent rent roll and the last 12 months of T-12 income?
- It's been on market 55 days. Have you received any prior offers? Is the seller open to a 33% concession, seller financing, or rate buy-down credit?
- What does the HOA fee cover, when was the last increase, and are there any pending special assessments or reserve-fund shortfalls?
- Is there a deadline driving the sale (1031 exchange, divorce, estate, relocation)? That informs how much negotiation room exists.
- The area grade is low — what's the realistic commute time and amenity access for the typical tenant pool here? Any planned neighborhood developments (good or bad) we should know about?
- What's the average days-on-market for RENTAL listings here right now (not sales)? A rising rental-DOM trend means longer vacancies and softer asking-rent achievability than the comps imply.
- What's the recent tenant-quality profile in this submarket — average credit score on applications, eviction rate, late-payment / NSF rate, and stable-employment percentage? A property-management company in the area should have these aggregated.
- How much new for-sale + rental construction is in the pipeline within 1–3 miles? Heavy new supply typically softens prices + rents 12–24 months out; constrained supply supports both.
CashFlowRE · CFR-1WHZKWA604RCKA
· Data 3 weeks ago
cashflowre.app · 2026-05-29