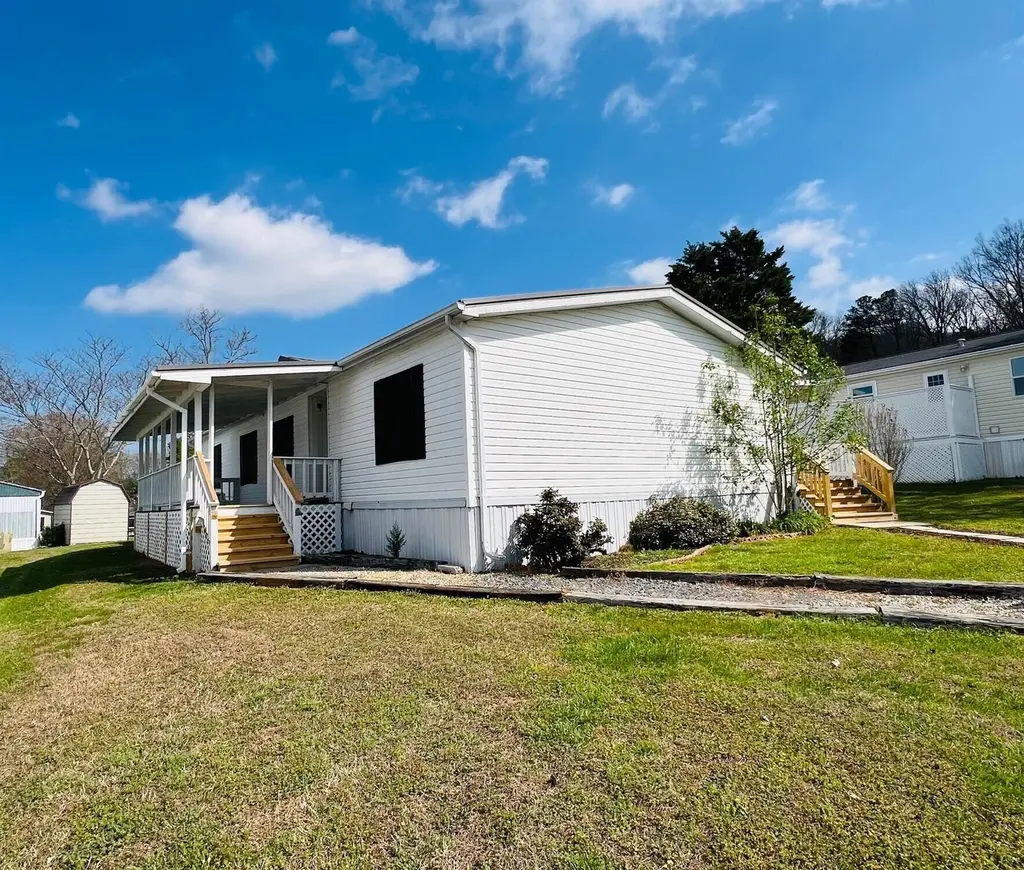
5897 Ed Ken Dr
Collegedale, TN 37363
$115,000B-
3 bd · 2.0 ba ·
1,624 sqft ·
Built 1996
· Manufactured
· Active
· 79 DOM
Cashflow @ list (25.0% down · 7.5%)
Estimated rent
$2,236/mo
Mortgage (P&I)
−$603
Tax + insurance
−$192
HOA
−$625
Vac / Maint / Mgmt
−$470
Net cashflow
$347/mo
Annual
$4,160/yr
Cap rate
9.91%
Cash-on-cash
12.92%
DSCR
1.57
1% rule
1.94%
Cash to close
$32,200
Investor read
- This is a 3-bed/2.0-bath manufactured listed at $115k. Condition is rated good.
- At list price, monthly cash flow is $347 ($4k/yr) — positive.
- The deal already cash-flows at list — no discount required.
- Meets the 1% rule at list price ($2k rent vs $115k).
- It's been on market 79 days — a 6% lower offer ($108k) is reasonable based on typical stale-listing flexibility.
- Recommended offer: $108k (6.0% below list) — sets the bar for market timing.
- Local home prices are declining (-3.0%/yr); year-one equity from $795 of loan paydown is wiped out by about $3k of value loss. Plan a longer hold.
- Location reads 67/100 on livability (#100 in TN) — a middle-class / working-renter tenant base. Strengths: crime A+, cost of living A+, housing A+; Watch: amenities F, commute F, health & safety F.
- Hamilton County (urban): math 31% / reading 31% proficiency, ranked #42 of 139 in TN (top 30%) — families likely to look elsewhere, expect single-tenant / working-renter base with shorter leases.
- Zoned schools: Ooltewah Elementary (math 60% / reading 52%, grade C+, #82 of 952 statewide, top 9%, 874 students, 0% FRL); Ooltewah Middle School (math 20% / reading 21%, grade F, #194 of 333 statewide, top 59%, 519 students, 0% FRL); Ooltewah High School (math 9% / reading 39%, grade F, #144 of 332 statewide, top 43%, 1,266 students, 0% FRL) — zoned schools average 0% FRL vs 52% district-wide (52 pts lower); this property's tenant base skews higher-income than the district average.
- Watch-outs: HOA is 28% of rent.
- Market conditions: Rents soft (-0.8%/yr); 733 active listings in the ZIP; solid renter incomes; 2,133 units permitted in Hamilton County in 2024 (405 in 5+ unit buildings).
- Hamilton County population projected at +23% by 2050 — long-run rental-demand tailwind backs the buy-and-hold thesis.
- Climate carrying-cost: extreme-heat days projected 7→20/yr by 2055 (HVAC capex compounding) — expect insurance premiums to compound above CPI over the hold.
- Cap rate 9.9% vs local median 3.1% in Collegedale — top-decile yield for the area; either an underpriced asset or a hidden risk that comps aren't pricing in. Stress-test before assuming the spread holds.
Questions for listing agent
- It's been on market 79 days. Have you received any prior offers? Is the seller open to a 6% concession, seller financing, or rate buy-down credit?
- What does the HOA fee cover, when was the last increase, and are there any pending special assessments or reserve-fund shortfalls?
- Why hasn't it sold? Are there any deal-killer items the seller is aware of (foundation, flood, title, zoning, code violations)?
- Is there a deadline driving the sale (1031 exchange, divorce, estate, relocation)? That informs how much negotiation room exists.
- Schools are D-rated, which usually means shorter tenancies and higher turnover. Who's the typical renter profile here, and what's been the actual vacancy rate?
- What's the average days-on-market for RENTAL listings here right now (not sales)? A rising rental-DOM trend means longer vacancies and softer asking-rent achievability than the comps imply.
- What's the recent tenant-quality profile in this submarket — average credit score on applications, eviction rate, late-payment / NSF rate, and stable-employment percentage? A property-management company in the area should have these aggregated.
- How much new for-sale + rental construction is in the pipeline within 1–3 miles? Heavy new supply typically softens prices + rents 12–24 months out; constrained supply supports both.
CashFlowRE · CFR-21E3YC90CW2M0S
· Data 2 days ago
cashflowre.app · 2026-05-29