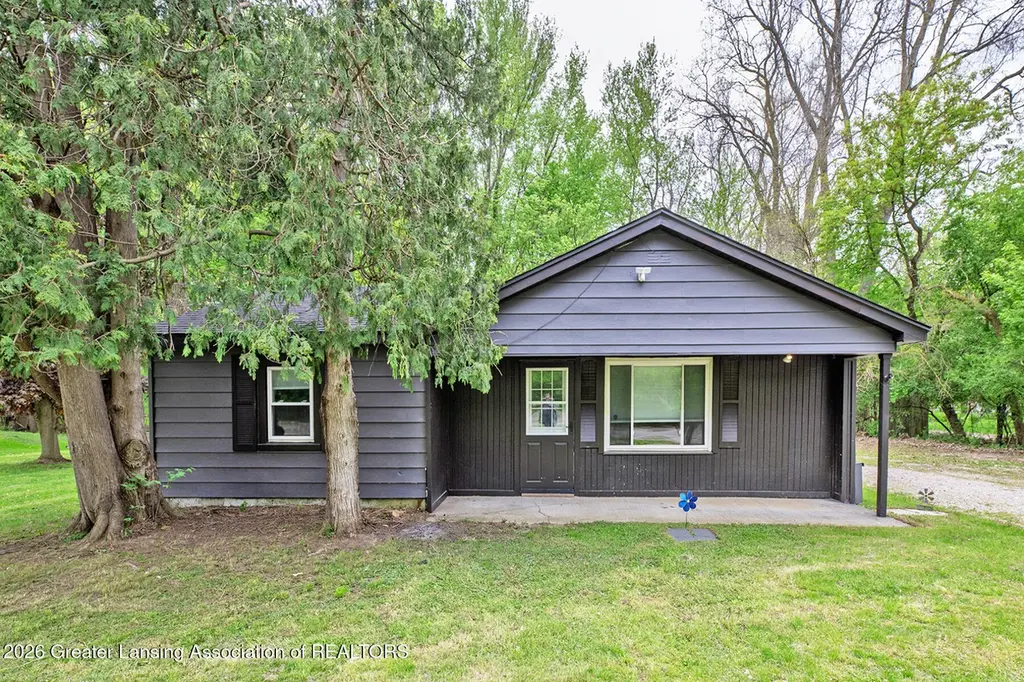
2275 E Lake Lansing Rd
Meridian, MI 48823
$205,000D
2 bd · 1.0 ba ·
1,453 sqft ·
Built 1948
· SingleFamily
· Active
· 34 DOM
Cashflow @ list (25.0% down · 7.5%)
Estimated rent
$1,500/mo
Mortgage (P&I)
−$1,075
Tax + insurance
−$319
HOA
−$0
Vac / Maint / Mgmt
−$315
Net cashflow
$-209/mo
Annual
$-2,505/yr
Cap rate
5.07%
Cash-on-cash
-4.36%
DSCR
0.81
1% rule
0.73%
Cash to close
$57,400
Investor read
- This is a 2-bed/1.0-bath single-family listed at $205k.
- At list price, monthly cash flow is $-209 ($-3k/yr) — negative.
- To cash-flow at today's rent, offer at most $168k (18.0% below list).
- To meet the 1% rule (rent ≥ 1% of price), the offer needs to be $150k (26.8% below list).
- It's been on market 34 days — a 3% lower offer ($199k) is reasonable based on typical stale-listing flexibility.
- Recommended offer: $150k (26.8% below list) — sets the bar for 1% rule.
- Local home prices are declining (-3.0%/yr); year-one equity from $1k of loan paydown is wiped out by about $6k of value loss. Plan a longer hold.
- Location reads: area grade D — affects rentability + tenant quality, not the cash-flow math above.
- Haslett Public Schools (suburban): math 55% / reading 63% proficiency, ranked #44 of 540 in MI (top 8%) — acceptable for families but not a draw, mixed tenant base, ~2y average lease; only 19% free/reduced lunch — higher-income household profile.
- Watch-outs: built in 1948 — expect roof / HVAC / electrical / plumbing capex.
- Market conditions: Rents rising (+2.4%/yr); 170 active listings in the ZIP; 5 comparable units currently listed for rent nearby; rentals lingering (median 45d on market — plan ~5-8 weeks vacancy on turnover, expect pricing pressure); 60% of comp listings sitting > 30 days — soft ceiling on asking rent; 350 units permitted in Ingham County in 2024 (186 in 5+ unit buildings).
- Ingham County population projected at +11% by 2050 — modest demand growth; plan on rents tracking national, not racing it.
- 4 sale attempts with the ask held roughly flat each time — persistent listings suggest the price (not the market) is what's stuck; bring a comps-based counter.
- This rent runs 35% of the median local income ($52k/yr) — at the standard rent-burdened threshold; future hikes will face affordability resistance.
Questions for listing agent
- What do current leases actually rent for vs. the listed asking? Can we see a recent rent roll and the last 12 months of T-12 income?
- It's been on market 34 days. Have you received any prior offers? Is the seller open to a 27% concession, seller financing, or rate buy-down credit?
- Built in 1948 — when were the roof, HVAC, electrical panel, plumbing, and water heater last replaced?
- Is there a deadline driving the sale (1031 exchange, divorce, estate, relocation)? That informs how much negotiation room exists.
- The area grade is low — what's the realistic commute time and amenity access for the typical tenant pool here? Any planned neighborhood developments (good or bad) we should know about?
- What's the average days-on-market for RENTAL listings here right now (not sales)? A rising rental-DOM trend means longer vacancies and softer asking-rent achievability than the comps imply.
- What's the recent tenant-quality profile in this submarket — average credit score on applications, eviction rate, late-payment / NSF rate, and stable-employment percentage? A property-management company in the area should have these aggregated.
- How much new for-sale + rental construction is in the pipeline within 1–3 miles? Heavy new supply typically softens prices + rents 12–24 months out; constrained supply supports both.
CashFlowRE · CFR-228DSC7HAEH7H5
· Data 2 days ago
cashflowre.app · 2026-05-29