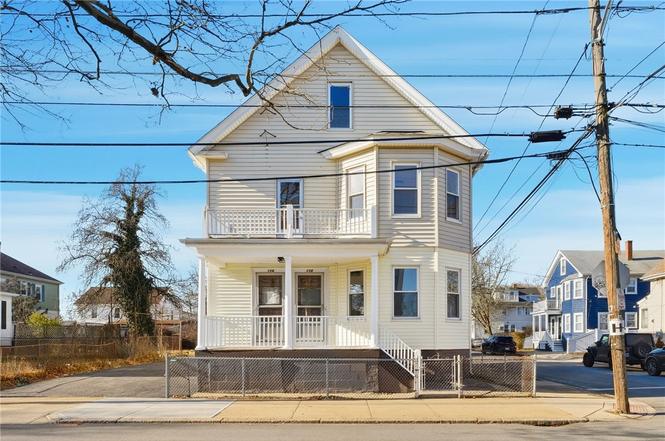
116 Mount Pleasant Ave
Providence, RI 02908
$625,000D
8 bd · 3.0 ba ·
3,000 sqft ·
Built 1913
· MultiFamily
· Pending
· 8 DOM
Cashflow @ list (25.0% down · 7.5%)
Estimated rent
$5,537/mo
Mortgage (P&I)
−$3,278
Tax + insurance
−$1,042
HOA
−$0
Vac / Maint / Mgmt
−$1,163
Net cashflow
$55/mo
Annual
$660/yr
Cap rate
6.40%
Cash-on-cash
0.38%
DSCR
1.02
1% rule
0.89%
Cash to close
$175,000
Investor read
- This is a 2 × 3-bed/1.5-bath units multifamily listed at $625k.
- At list price, monthly cash flow is $55 ($660/yr) — positive. Per door: $27/mo.
- The deal already cash-flows at list — no discount required.
- To meet the 1% rule (rent ≥ 1% of price), the offer needs to be $554k (11.4% below list).
- Only 8 days on market — expect competitive offers; lowballing is unlikely to land.
- Recommended offer: $554k (11.4% below list) — sets the bar for 1% rule.
- Local home prices are declining (-3.0%/yr); year-one equity from $4k of loan paydown is wiped out by about $19k of value loss. Plan a longer hold.
- Location reads 84/100 on livability (#2 in RI, #794 nationally) — a professional / high-income tenant draw. Strengths: amenities A+, commute A+, housing A+; Watch: employment C-.
- Providence (urban): math 8% / reading 16% proficiency, ranked #34 of 39 in RI (top 87%) — low school quality limits family demand, transient renter base, plan for 1-2y turnover; 79% free/reduced lunch — lower-income household profile, screen leases tightly.
- Zoned schools: George J. West El. School (math 7% / reading 13%, grade F, #148 of 167 statewide, top 90%, 601 students, 84% FRL); Nathanael Greene Middle (math 10% / reading 23%, grade F, #37 of 57 statewide, top 64%, 808 students, 85% FRL); Central High School (math 2% / reading 12%, grade F, #53 of 58 statewide, top 96%, 1,302 students, 87% FRL).
- Watch-outs: built in 1913 — expect roof / HVAC / electrical / plumbing capex.
- Market conditions: Rents rising fast (+5.5%/yr); 163 active listings in the ZIP; 776 units permitted in Providence County in 2024 (229 in 5+ unit buildings).
- Providence County population projected at +5% by 2050 — modest demand growth; plan on rents tracking national, not racing it.
- Cap rate 6.4% vs local median 4.0% in Providence — top-decile yield for the area; either an underpriced asset or a hidden risk that comps aren't pricing in. Stress-test before assuming the spread holds.
- At $5,537/mo this rent would consume 91% of the median local household income ($73k/yr) (locally 1561% of renters already pay >50% of income on rent) — very limited rent-growth headroom before tenants either downsize or default.
Questions for listing agent
- Can we see the unit-by-unit rent roll, current vacancy, and any below-market leases? What's the average tenancy length?
- What capital expenditures (roof, boiler, parking lot, exteriors) have been made in the last 5 years, and what's planned in the next 2?
- Built in 1913 — when were the roof, HVAC, electrical panel, plumbing, and water heater last replaced?
- Is there a deadline driving the sale (1031 exchange, divorce, estate, relocation)? That informs how much negotiation room exists.
- Schools are F-rated, which usually means shorter tenancies and higher turnover. Who's the typical renter profile here, and what's been the actual vacancy rate?
- The area grade is low — what's the realistic commute time and amenity access for the typical tenant pool here? Any planned neighborhood developments (good or bad) we should know about?
- What's the average days-on-market for RENTAL listings here right now (not sales)? A rising rental-DOM trend means longer vacancies and softer asking-rent achievability than the comps imply.
- What's the recent tenant-quality profile in this submarket — average credit score on applications, eviction rate, late-payment / NSF rate, and stable-employment percentage? A property-management company in the area should have these aggregated.
CashFlowRE · CFR-23JMPHFVNBCQWT
· Data 4 weeks ago
cashflowre.app · 2026-05-29