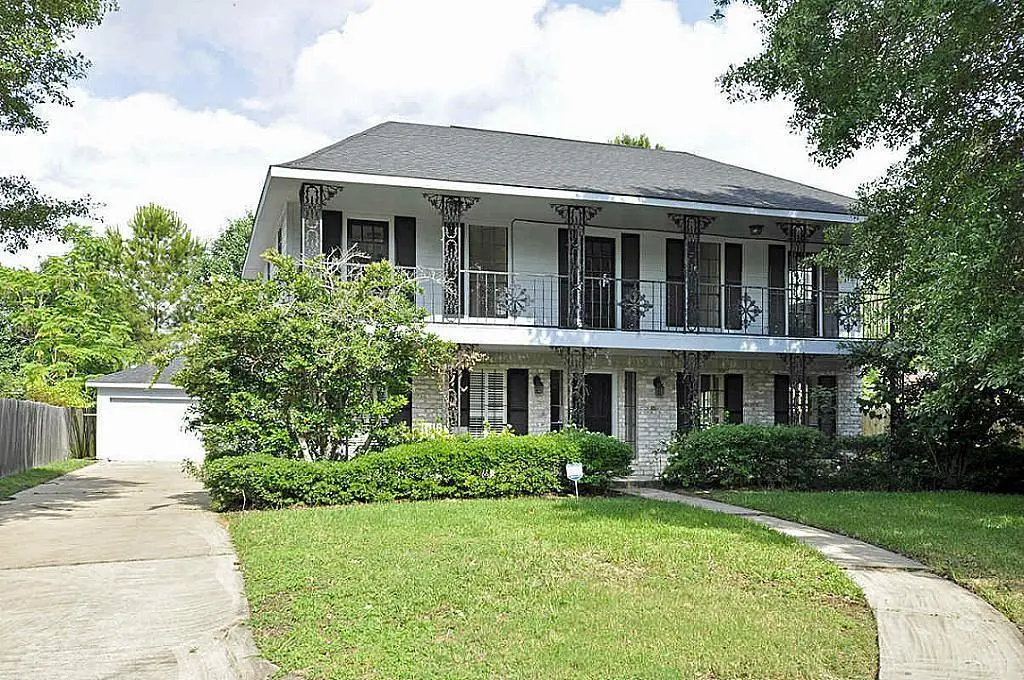
2211 Ashmont Ct
Missouri City, TX 77489
$249,000D+
4 bd · 3.0 ba ·
2,276 sqft ·
Built 1978
· SingleFamily
· Active
· 20 DOM
Cashflow @ list (25.0% down · 7.5%)
Estimated rent
$2,380/mo
Mortgage (P&I)
−$1,306
Tax + insurance
−$622
HOA
−$15
Vac / Maint / Mgmt
−$500
Net cashflow
$-62/mo
Annual
$-749/yr
Cap rate
5.99%
Cash-on-cash
-1.07%
DSCR
0.95
1% rule
0.96%
Cash to close
$69,720
Investor read
- This is a 4-bed/3.0-bath single-family listed at $249k.
- At list price, monthly cash flow is $-62 ($-749/yr) — negative.
- To cash-flow at today's rent, offer at most $238k (4.4% below list).
- To meet the 1% rule (rent ≥ 1% of price), the offer needs to be $238k (4.4% below list).
- It's been on market 20 days — a 2% lower offer ($245k) is reasonable based on typical stale-listing flexibility.
- Recommended offer: $238k (4.4% below list) — sets the bar for cash-flow.
- In year one you build about $350 of equity ($2k loan paydown + $-1k appreciation (-0.6% local appreciation)).
- Location reads 67/100 on livability (#526 in TX) — a middle-class / working-renter tenant base. Strengths: housing A+, crime A, employment A; Watch: amenities F, commute F, health & safety F.
- Fort Bend ISD (suburban): math 44% / reading 53% proficiency, ranked #140 of 826 in TX (top 17%) — families likely to look elsewhere, expect single-tenant / working-renter base with shorter leases.
- Market conditions: Rents flat; 186 active listings in the ZIP; 12 comparable units currently listed for rent nearby; rentals at typical pace (median 24d on market — plan ~3-4 weeks tenant-placement turnaround); 42% of comp listings sitting > 30 days — soft ceiling on asking rent; 12,093 units permitted in Fort Bend County in 2024 (815 in 5+ unit buildings).
- Fort Bend County population projected at +75% by 2050 — long-run rental-demand tailwind backs the buy-and-hold thesis.
- 6 sale attempts since 11y ago; this cycle's ask is 12350% above the opening price — seller raised mid-cycle; expect resistance to lowballs.
- Climate carrying-cost: major flood risk; severe wind risk, 99% chance of damaging wind over 30y; extreme-heat days projected 7→23/yr by 2055 (HVAC capex compounding) — expect insurance premiums to compound above CPI over the hold.
- Cap rate 6.0% vs local median 3.5% in Missouri City — top-decile yield for the area; either an underpriced asset or a hidden risk that comps aren't pricing in. Stress-test before assuming the spread holds.
- This rent runs 38% of the median local income ($75k/yr) — at the standard rent-burdened threshold; future hikes will face affordability resistance.
Questions for listing agent
- What do current leases actually rent for vs. the listed asking? Can we see a recent rent roll and the last 12 months of T-12 income?
- Built in 1978 — when were the roof, HVAC, electrical panel, plumbing, and water heater last replaced?
- What does the HOA fee cover, when was the last increase, and are there any pending special assessments or reserve-fund shortfalls?
- Is there a deadline driving the sale (1031 exchange, divorce, estate, relocation)? That informs how much negotiation room exists.
- Schools are B-rated — typically a magnet for longer-tenancy family renters. What's the average tenant stay here, and is there a school-zone premium baked into asking?
- The area grade is low — what's the realistic commute time and amenity access for the typical tenant pool here? Any planned neighborhood developments (good or bad) we should know about?
- What's the average days-on-market for RENTAL listings here right now (not sales)? A rising rental-DOM trend means longer vacancies and softer asking-rent achievability than the comps imply.
- What's the recent tenant-quality profile in this submarket — average credit score on applications, eviction rate, late-payment / NSF rate, and stable-employment percentage? A property-management company in the area should have these aggregated.
CashFlowRE · CFR-275P5KACM9GCSB
· Data 2 days ago
cashflowre.app · 2026-05-29