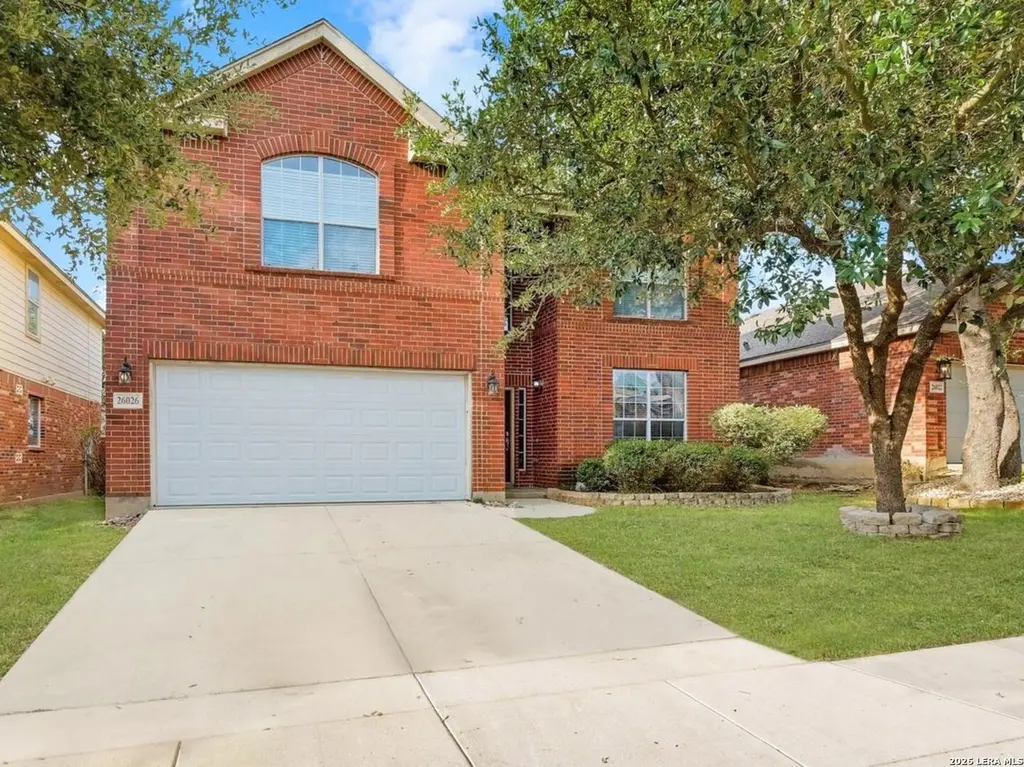
26026 Copperas Ln
Timberwood Park, TX 78260
$375,000D
4 bd · 2.5 ba ·
3,072 sqft ·
Built 2005
· SingleFamily
· Pending
· 10 DOM
Cashflow @ list (25.0% down · 7.5%)
Estimated rent
$2,868/mo
Mortgage (P&I)
−$1,967
Tax + insurance
−$429
HOA
−$132
Vac / Maint / Mgmt
−$602
Net cashflow
$-261/mo
Annual
$-3,136/yr
Cap rate
5.46%
Cash-on-cash
-2.99%
DSCR
0.87
1% rule
0.76%
Cash to close
$105,000
Investor read
- This is a 4-bed/2.5-bath single-family listed at $375k.
- At list price, monthly cash flow is $-261 ($-3k/yr) — negative.
- To cash-flow at today's rent, offer at most $329k (12.3% below list).
- To meet the 1% rule (rent ≥ 1% of price), the offer needs to be $287k (23.5% below list).
- Only 10 days on market — expect competitive offers; lowballing is unlikely to land.
- Recommended offer: $287k (23.5% below list) — sets the bar for 1% rule.
- Local home prices are declining (-3.0%/yr); year-one equity from $3k of loan paydown is wiped out by about $11k of value loss. Plan a longer hold.
- Location reads 66/100 on livability (#607 in TX) — a middle-class / working-renter tenant base. Strengths: employment A+, housing A+, crime A; Watch: cost of living D, amenities F, commute F.
- Comal ISD (rural): math 57% / reading 59% proficiency, ranked #58 of 826 in TX (top 7%) — acceptable for families but not a draw, mixed tenant base, ~2y average lease.
- Zoned schools: Mh Specht El (math 52% / reading 56%, grade C, #664 of 4,322 statewide, top 16%, 802 students, 28% FRL); Pieper H S (1,450 students, 16% FRL).
- Market conditions: Rents rising (+3.0%/yr); 388 active listings in the ZIP; 24 comparable units currently listed for rent nearby; rentals leasing fast (median 13d on market — plan ~1-2 weeks tenant-placement turnaround); high-income renter base; 8,308 units permitted in Bexar County in 2024 (2,506 in 5+ unit buildings).
- Bexar County population projected at +50% by 2050 — long-run rental-demand tailwind backs the buy-and-hold thesis.
- 4 sale attempts since 6y ago with the ask held roughly flat each time — persistent listings suggest the price (not the market) is what's stuck; bring a comps-based counter.
- Climate carrying-cost: major wind risk, 70% chance of damaging wind over 30y; extreme-heat days projected 7→22/yr by 2055 (HVAC capex compounding) — expect insurance premiums to compound above CPI over the hold.
- Cap rate 5.5% vs local median 2.8% in Timberwood Park — top-decile yield for the area; either an underpriced asset or a hidden risk that comps aren't pricing in. Stress-test before assuming the spread holds.
Questions for listing agent
- What do current leases actually rent for vs. the listed asking? Can we see a recent rent roll and the last 12 months of T-12 income?
- What does the HOA fee cover, when was the last increase, and are there any pending special assessments or reserve-fund shortfalls?
- Is there a deadline driving the sale (1031 exchange, divorce, estate, relocation)? That informs how much negotiation room exists.
- Schools are D-rated, which usually means shorter tenancies and higher turnover. Who's the typical renter profile here, and what's been the actual vacancy rate?
- The area grade is low — what's the realistic commute time and amenity access for the typical tenant pool here? Any planned neighborhood developments (good or bad) we should know about?
- What's the average days-on-market for RENTAL listings here right now (not sales)? A rising rental-DOM trend means longer vacancies and softer asking-rent achievability than the comps imply.
- What's the recent tenant-quality profile in this submarket — average credit score on applications, eviction rate, late-payment / NSF rate, and stable-employment percentage? A property-management company in the area should have these aggregated.
- How much new for-sale + rental construction is in the pipeline within 1–3 miles? Heavy new supply typically softens prices + rents 12–24 months out; constrained supply supports both.
CashFlowRE · CFR-278YNY3CX7JSQ3
· Data 3 weeks ago
cashflowre.app · 2026-05-29