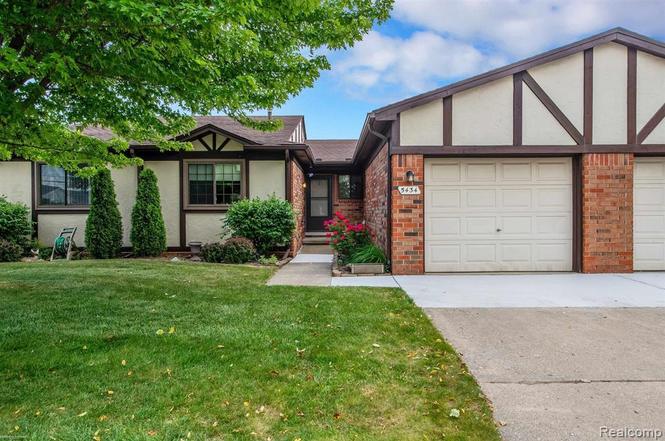
5434 Bowden Ct
Warren, MI 48091
$164,900D
2 bd · 1.5 ba ·
1,515 sqft ·
Built 1991
· Condo
· Pending
· 73 DOM
Cashflow @ list (25.0% down · 7.5%)
Estimated rent
$1,761/mo
Mortgage (P&I)
−$865
Tax + insurance
−$330
HOA
−$220
Vac / Maint / Mgmt
−$370
Net cashflow
$-24/mo
Annual
$-291/yr
Cap rate
6.52%
Cash-on-cash
0.81%
DSCR
1.04
1% rule
1.07%
Cash to close
$46,172
Investor read
- This is a 2-bed/1.5-bath condo listed at $165k.
- At list price, monthly cash flow is $-24 ($-291/yr) — negative.
- To cash-flow at today's rent, offer at most $161k (2.1% below list).
- Meets the 1% rule at list price ($2k rent vs $165k).
- It's been on market 73 days — a 6% lower offer ($155k) is reasonable based on typical stale-listing flexibility.
- Recommended offer: $155k (6.0% below list) — sets the bar for market timing.
- Local home prices are declining (-3.0%/yr); year-one equity from $1k of loan paydown is wiped out by about $5k of value loss. Plan a longer hold.
- Location reads 74/100 on livability (#171 in MI, #4,491 nationally) — a middle-class / working-renter tenant base. Strengths: commute A+, cost of living A+, housing A+; Watch: schools D, amenities D, employment D.
- Center Line Public Schools (suburban): math 14% / reading 29% proficiency, ranked #459 of 540 in MI (top 85%) — low school quality limits family demand, transient renter base, plan for 1-2y turnover; 60% free/reduced lunch — lower-income household profile, screen leases tightly.
- Watch-outs: flood insurance adds $56/mo.
- Market conditions: Rents rising (+2.4%/yr); 168 active listings in the ZIP; 5 comparable units currently listed for rent nearby; rentals leasing fast (median 13d on market — plan ~1-2 weeks tenant-placement turnaround); 1,321 units permitted in Macomb County in 2024 (86 in 5+ unit buildings).
- Macomb County population projected at +9% by 2050 — modest demand growth; plan on rents tracking national, not racing it.
- 13 sale attempts since 3y ago with the ask held roughly flat each time — persistent listings suggest the price (not the market) is what's stuck; bring a comps-based counter.
- Climate carrying-cost: major flood risk — expect insurance premiums to compound above CPI over the hold.
- Cap rate 6.5% vs local median 5.2% in Warren — meaningfully above typical; check what's discounted (condition, days-on-market, listing class) to confirm the premium yield is real.
- This rent runs 39% of the median local income ($54k/yr) — at the standard rent-burdened threshold; future hikes will face affordability resistance.
Questions for listing agent
- What do current leases actually rent for vs. the listed asking? Can we see a recent rent roll and the last 12 months of T-12 income?
- It's been on market 73 days. Have you received any prior offers? Is the seller open to a 6% concession, seller financing, or rate buy-down credit?
- What's the actual annual flood-insurance premium (NFIP or private), and is the property in a SFHA with mandatory coverage?
- What does the HOA fee cover, when was the last increase, and are there any pending special assessments or reserve-fund shortfalls?
- Any open or pending special assessments — roof, HVAC, plumbing, elevator, façade? What's the per-unit balance and payoff schedule, and is the seller paying it off at close or rolling it to the buyer?
- Why hasn't it sold? Are there any deal-killer items the seller is aware of (foundation, flood, title, zoning, code violations)?
- Is there a deadline driving the sale (1031 exchange, divorce, estate, relocation)? That informs how much negotiation room exists.
- Schools are D-rated, which usually means shorter tenancies and higher turnover. Who's the typical renter profile here, and what's been the actual vacancy rate?
CashFlowRE · CFR-279SMSCC38413V
· Data 1 week ago
cashflowre.app · 2026-05-29