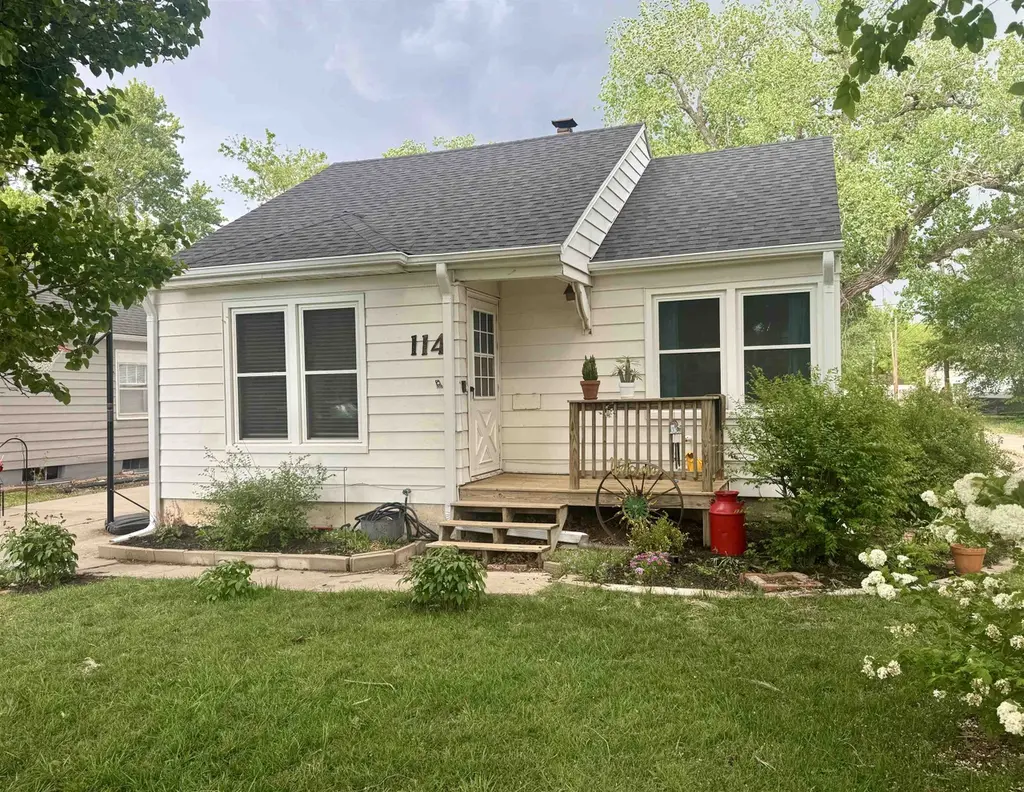
114 N Olivette St
McPherson, KS 67460
$135,000F
2 bd · 2.0 ba ·
776 sqft ·
Built 1942
· SingleFamily
· Pending
· 1 DOM
Cashflow @ list (25.0% down · 7.5%)
Estimated rent
$965/mo
Mortgage (P&I)
−$708
Tax + insurance
−$232
HOA
−$0
Vac / Maint / Mgmt
−$203
Net cashflow
$-177/mo
Annual
$-2,128/yr
Cap rate
4.72%
Cash-on-cash
-5.63%
DSCR
0.75
1% rule
0.71%
Cash to close
$37,800
Investor read
- This is a 2-bed/2.0-bath single-family listed at $135k.
- At list price, monthly cash flow is $-177 ($-2k/yr) — negative.
- To cash-flow at today's rent, offer at most $104k (23.2% below list).
- To meet the 1% rule (rent ≥ 1% of price), the offer needs to be $96k (28.5% below list).
- Only 1 days on market — expect competitive offers; lowballing is unlikely to land.
- Recommended offer: $96k (28.5% below list) — sets the bar for 1% rule.
- Local home prices are declining (-3.0%/yr); year-one equity from $933 of loan paydown is wiped out by about $4k of value loss. Plan a longer hold.
- Location reads 81/100 on livability (#12 in KS, #1,567 nationally) — a professional / high-income tenant draw. Strengths: amenities A+, cost of living A+, housing A+; Watch: commute F.
- Mcpherson (town): math 25% / reading 32% proficiency, ranked #103 of 169 in KS (top 61%) — low school quality limits family demand, transient renter base, plan for 1-2y turnover.
- Zoned schools: Washington Elem (math 37% / reading 42%, grade F, #321 of 684 statewide, top 52%, 285 students, 47% FRL); Mcpherson Middle School (math 21% / reading 27%, grade F, #121 of 219 statewide, top 56%, 492 students, 42% FRL); Mcpherson High (math 22% / reading 22%, grade F, #165 of 327 statewide, top 55%, 709 students, 36% FRL).
- Watch-outs: built in 1942 — expect roof / HVAC / electrical / plumbing capex.
- Market conditions: 149 active listings in the ZIP; 2 comparable units currently listed for rent nearby; solid renter incomes; 102 units permitted in McPherson County in 2024 (0 in 5+ unit buildings).
- McPherson County population projected to shrink 6% by 2050 — rents likely to lag national; underwrite the cash flow, not the appreciation.
- 4 sale attempts since 23y ago with the ask held roughly flat each time — persistent listings suggest the price (not the market) is what's stuck; bring a comps-based counter.
- Current owner paid $59k; list at $135k implies a 129% gain — meaningful room to come down on a strong offer.
- Climate carrying-cost: extreme-heat days projected 7→18/yr by 2055 (HVAC capex compounding) — expect insurance premiums to compound above CPI over the hold.
- This rent is only 14% of the median local income ($81k/yr) — well below the 30% rent-burden line; pricing power to push rent on renewal without tenant pushback.
Questions for listing agent
- What do current leases actually rent for vs. the listed asking? Can we see a recent rent roll and the last 12 months of T-12 income?
- Built in 1942 — when were the roof, HVAC, electrical panel, plumbing, and water heater last replaced?
- Is there a deadline driving the sale (1031 exchange, divorce, estate, relocation)? That informs how much negotiation room exists.
- The area grade is low — what's the realistic commute time and amenity access for the typical tenant pool here? Any planned neighborhood developments (good or bad) we should know about?
- What's the average days-on-market for RENTAL listings here right now (not sales)? A rising rental-DOM trend means longer vacancies and softer asking-rent achievability than the comps imply.
- What's the recent tenant-quality profile in this submarket — average credit score on applications, eviction rate, late-payment / NSF rate, and stable-employment percentage? A property-management company in the area should have these aggregated.
- How much new for-sale + rental construction is in the pipeline within 1–3 miles? Heavy new supply typically softens prices + rents 12–24 months out; constrained supply supports both.
CashFlowRE · CFR-27XYJM5MPPVS8R
· Data 3 weeks ago
cashflowre.app · 2026-05-29