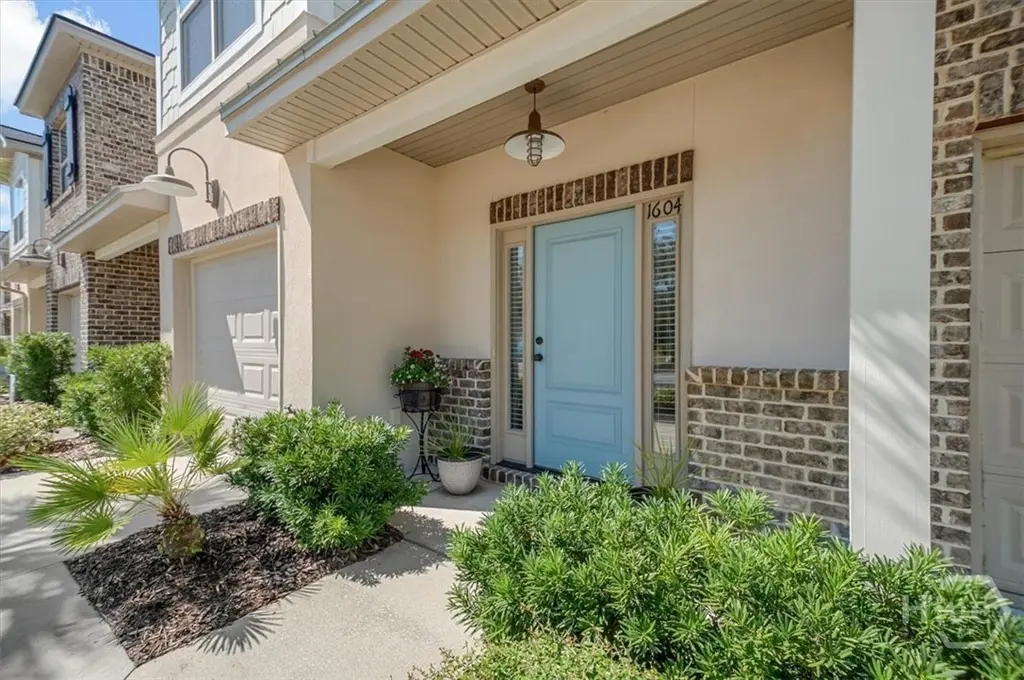
1604 Mariners Cir
St. Simons, GA 31522
$479,000C
3 bd · 2.0 ba ·
1,596 sqft ·
Built 2016
· Townhouse
· Under Contract
· 97 DOM
Cashflow @ list (25.0% down · 7.5%)
Estimated rent
$4,623/mo
Mortgage (P&I)
−$2,512
Tax + insurance
−$578
HOA
−$36
Vac / Maint / Mgmt
−$971
Net cashflow
$526/mo
Annual
$6,311/yr
Cap rate
7.61%
Cash-on-cash
4.71%
DSCR
1.21
1% rule
0.97%
Cash to close
$134,120
Investor read
- This is a 3-bed/2.0-bath townhouse listed at $479k.
- At list price, monthly cash flow is $526 ($6k/yr) — positive.
- The deal already cash-flows at list — no discount required.
- To meet the 1% rule (rent ≥ 1% of price), the offer needs to be $462k (3.5% below list).
- It's been on market 97 days — a 9% lower offer ($436k) is reasonable based on typical stale-listing flexibility.
- Recommended offer: $436k (9.0% below list) — sets the bar for market timing.
- Local home prices are declining (-3.0%/yr); year-one equity from $3k of loan paydown is wiped out by about $14k of value loss. Plan a longer hold.
- Location reads: area grade C — affects rentability + tenant quality, not the cash-flow math above.
- Glynn County (other): math 37% / reading 42% proficiency, ranked #47 of 174 in GA (top 27%) — families likely to look elsewhere, expect single-tenant / working-renter base with shorter leases.
- Market conditions: Rents rising (+2.3%/yr); 580 active listings in the ZIP; 3 comparable units currently listed for rent nearby; rentals lingering (median 45d on market — plan ~5-8 weeks vacancy on turnover, expect pricing pressure); 100% of comp listings sitting > 30 days — soft ceiling on asking rent; solid renter incomes; 734 units permitted in Glynn County in 2024 (136 in 5+ unit buildings).
- Glynn County population projected at +13% by 2050 — modest demand growth; plan on rents tracking national, not racing it.
- 7 sale attempts since 10y ago; this cycle's ask has dropped $46k (9%) from the opening price — seller is motivated, your offer sets the floor, not the list.
- Climate carrying-cost: major flood risk; severe wind risk, 99% chance of damaging wind over 30y; extreme-heat days projected 7→21/yr by 2055 (HVAC capex compounding) — expect insurance premiums to compound above CPI over the hold.
- Cap rate 7.6% vs local median 1.7% in St. Simons — top-decile yield for the area; either an underpriced asset or a hidden risk that comps aren't pricing in. Stress-test before assuming the spread holds.
- At $4,623/mo this rent would consume 51% of the median local household income ($109k/yr) (locally 339% of renters already pay >50% of income on rent) — very limited rent-growth headroom before tenants either downsize or default.
Questions for listing agent
- It's been on market 97 days. Have you received any prior offers? Is the seller open to a 9% concession, seller financing, or rate buy-down credit?
- What does the HOA fee cover, when was the last increase, and are there any pending special assessments or reserve-fund shortfalls?
- Why hasn't it sold? Are there any deal-killer items the seller is aware of (foundation, flood, title, zoning, code violations)?
- Is there a deadline driving the sale (1031 exchange, divorce, estate, relocation)? That informs how much negotiation room exists.
- What's the average days-on-market for RENTAL listings here right now (not sales)? A rising rental-DOM trend means longer vacancies and softer asking-rent achievability than the comps imply.
- What's the recent tenant-quality profile in this submarket — average credit score on applications, eviction rate, late-payment / NSF rate, and stable-employment percentage? A property-management company in the area should have these aggregated.
- How much new for-sale + rental construction is in the pipeline within 1–3 miles? Heavy new supply typically softens prices + rents 12–24 months out; constrained supply supports both.
CashFlowRE · CFR-28W1R4E4D9Z0XJ
· Data 4 days ago
cashflowre.app · 2026-05-29