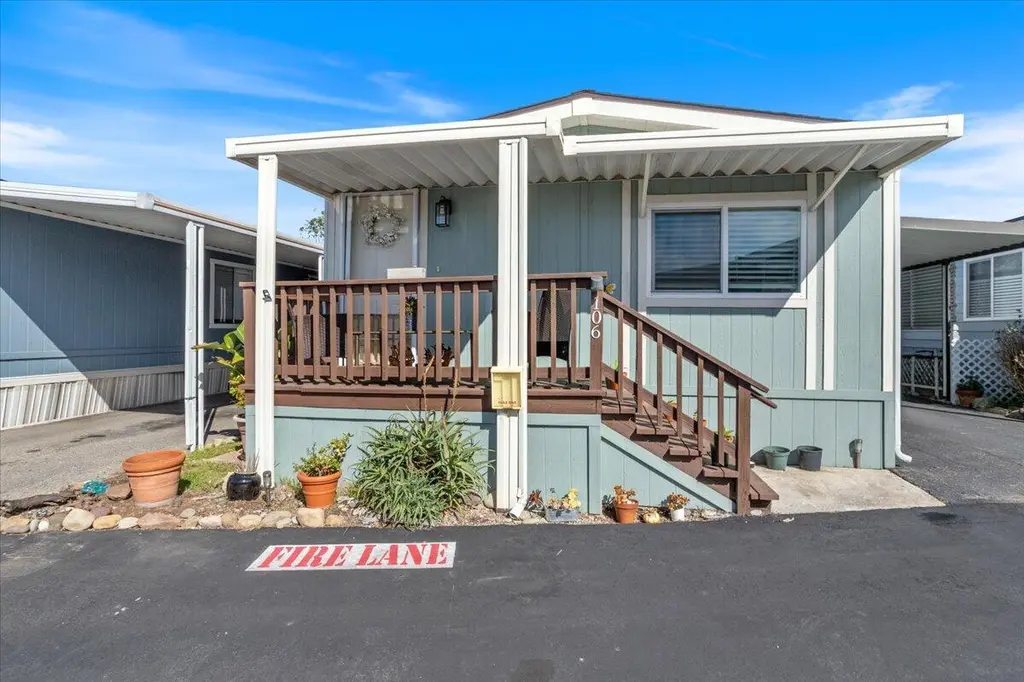
5700 Via Real #106
Carpinteria, CA 93013
$440,000B
2 bd · 2.0 ba ·
1,120 sqft ·
Built 1984
· Manufactured
· Pending
· 108 DOM
Cashflow @ list (25.0% down · 7.5%)
Estimated rent
$6,438/mo
Mortgage (P&I)
−$2,307
Tax + insurance
−$733
HOA
−$0
Vac / Maint / Mgmt
−$1,352
Net cashflow
$2,045/mo
Annual
$24,545/yr
Cap rate
11.87%
Cash-on-cash
19.92%
DSCR
1.89
1% rule
1.46%
Cash to close
$123,200
Investor read
- This is a 2-bed/2.0-bath manufactured listed at $440k.
- At list price, monthly cash flow is $2k ($25k/yr) — positive.
- The deal already cash-flows at list — no discount required.
- Meets the 1% rule at list price ($6k rent vs $440k).
- It's been on market 108 days — a 9% lower offer ($400k) is reasonable based on typical stale-listing flexibility.
- Recommended offer: $400k (9.0% below list) — sets the bar for market timing.
- Local home prices are declining (-3.0%/yr); year-one equity from $3k of loan paydown is wiped out by about $13k of value loss. Plan a longer hold.
- Location reads 68/100 on livability (#283 in CA) — a middle-class / working-renter tenant base. Strengths: commute A+, employment A+, crime B+; Watch: schools D+, amenities F, cost of living F.
- Carpinteria Unified (suburban): math 27% / reading 43% proficiency, ranked #255 of 517 in CA (top 49%) — families likely to look elsewhere, expect single-tenant / working-renter base with shorter leases.
- Market conditions: Rents rising fast (+15.2%/yr); 75 active listings in the ZIP; 5 comparable units currently listed for rent nearby; rentals at typical pace (median 15d on market — plan ~3-4 weeks tenant-placement turnaround); 40% of comp listings sitting > 30 days — soft ceiling on asking rent; high-income renter base; 719 units permitted in Santa Barbara County in 2024 (217 in 5+ unit buildings).
- Santa Barbara County population projected at +20% by 2050 — long-run rental-demand tailwind backs the buy-and-hold thesis.
- 7 sale attempts since 24y ago; this cycle's ask has dropped $70k (14%) from the opening price — seller is motivated, your offer sets the floor, not the list.
- At projected returns (-3.0% appreciation + 8.0% rent growth), your $123k cash investment doubles in ~5 years — after that, you're playing with house money.
- Climate carrying-cost: moderate flood risk; extreme-heat days projected 7→16/yr by 2055 (HVAC capex compounding) — expect insurance premiums to compound above CPI over the hold.
- Cap rate 11.9% vs local median 3.1% in Carpinteria — top-decile yield for the area; either an underpriced asset or a hidden risk that comps aren't pricing in. Stress-test before assuming the spread holds.
- At $6,438/mo this rent would consume 70% of the median local household income ($110k/yr) (locally 718% of renters already pay >50% of income on rent) — very limited rent-growth headroom before tenants either downsize or default.
Questions for listing agent
- It's been on market 108 days. Have you received any prior offers? Is the seller open to a 9% concession, seller financing, or rate buy-down credit?
- Why hasn't it sold? Are there any deal-killer items the seller is aware of (foundation, flood, title, zoning, code violations)?
- Is there a deadline driving the sale (1031 exchange, divorce, estate, relocation)? That informs how much negotiation room exists.
- Schools are D-rated, which usually means shorter tenancies and higher turnover. Who's the typical renter profile here, and what's been the actual vacancy rate?
- What's the average days-on-market for RENTAL listings here right now (not sales)? A rising rental-DOM trend means longer vacancies and softer asking-rent achievability than the comps imply.
- What's the recent tenant-quality profile in this submarket — average credit score on applications, eviction rate, late-payment / NSF rate, and stable-employment percentage? A property-management company in the area should have these aggregated.
- How much new for-sale + rental construction is in the pipeline within 1–3 miles? Heavy new supply typically softens prices + rents 12–24 months out; constrained supply supports both.
CashFlowRE · CFR-2B5RE6EE09B55Z
· Data 4 days ago
cashflowre.app · 2026-05-29