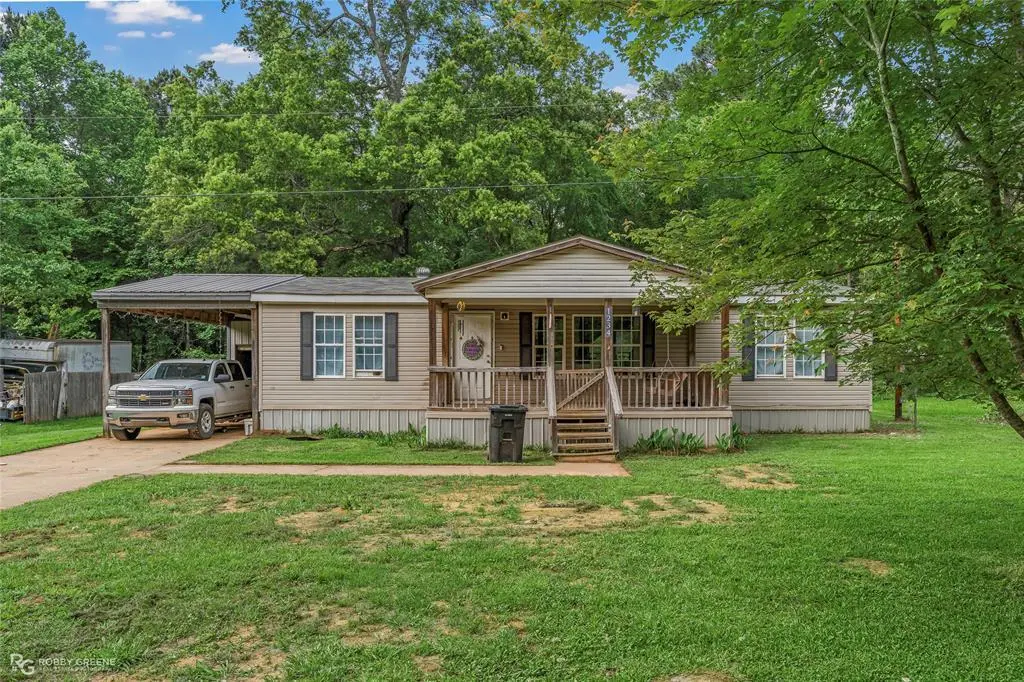
1234 Camp St
Haughton, LA 71037
$153,000B
3 bd · 2.0 ba ·
1,568 sqft ·
Built 2009
· Manufactured
· Active
· 51 DOM
Cashflow @ list (25.0% down · 7.5%)
Estimated rent
$1,951/mo
Mortgage (P&I)
−$802
Tax + insurance
−$255
HOA
−$0
Vac / Maint / Mgmt
−$410
Net cashflow
$484/mo
Annual
$5,804/yr
Cap rate
10.09%
Cash-on-cash
13.55%
DSCR
1.60
1% rule
1.27%
Cash to close
$42,840
Investor read
- This is a 3-bed/2.0-bath manufactured listed at $153k.
- At list price, monthly cash flow is $484 ($6k/yr) — positive.
- The deal already cash-flows at list — no discount required.
- Meets the 1% rule at list price ($2k rent vs $153k).
- It's been on market 51 days — a 3% lower offer ($148k) is reasonable based on typical stale-listing flexibility.
- Recommended offer: $148k (3.0% below list) — sets the bar for market timing.
- Local home prices are declining (-3.0%/yr); year-one equity from $1k of loan paydown is wiped out by about $5k of value loss. Plan a longer hold.
- Location reads 67/100 on livability (#105 in LA) — a middle-class / working-renter tenant base. Strengths: crime A+, cost of living A+, housing A+; Watch: employment C-, amenities F, commute F.
- Bossier Parish (urban): math 40% / reading 47% proficiency, ranked #17 of 98 in LA (top 17%) — families likely to look elsewhere, expect single-tenant / working-renter base with shorter leases.
- Zoned schools: Bossier Elementary School (math 8% / reading 17%, grade F, #550 of 646 statewide, top 88%, 222 students, 93% FRL) — zoned schools average 93% FRL vs 41% district-wide (52 pts higher); higher-poverty schools than district average — tighter screening recommended.
- Zoned-school proficiency averages 12% at this address vs 44% district-wide (-31 pts) — the specific schools serving this property underperform the Bossier Parish average; the district grade overstates school quality for this exact location.
- Market conditions: 333 active listings in the ZIP; 1 comparable units currently listed for rent nearby; solid renter incomes; 716 units permitted in Bossier Parish in 2024 (0 in 5+ unit buildings).
- Bossier County population projected at +28% by 2050 — long-run rental-demand tailwind backs the buy-and-hold thesis.
- 2 sale attempts since 3y ago with the ask held roughly flat each time — persistent listings suggest the price (not the market) is what's stuck; bring a comps-based counter.
- At projected returns (-3.0% appreciation + 3.0% rent growth), your $43k cash investment doubles in ~9 years — after that, you're playing with house money.
- Climate carrying-cost: major wind risk, 74% chance of damaging wind over 30y; extreme-heat days projected 7→22/yr by 2055 (HVAC capex compounding) — expect insurance premiums to compound above CPI over the hold.
- Cap rate 10.1% vs local median 5.4% in Haughton — top-decile yield for the area; either an underpriced asset or a hidden risk that comps aren't pricing in. Stress-test before assuming the spread holds.
Questions for listing agent
- It's been on market 51 days. Have you received any prior offers? Is the seller open to a 3% concession, seller financing, or rate buy-down credit?
- Is there a deadline driving the sale (1031 exchange, divorce, estate, relocation)? That informs how much negotiation room exists.
- Schools are B-rated — typically a magnet for longer-tenancy family renters. What's the average tenant stay here, and is there a school-zone premium baked into asking?
- What's the average days-on-market for RENTAL listings here right now (not sales)? A rising rental-DOM trend means longer vacancies and softer asking-rent achievability than the comps imply.
- What's the recent tenant-quality profile in this submarket — average credit score on applications, eviction rate, late-payment / NSF rate, and stable-employment percentage? A property-management company in the area should have these aggregated.
- How much new for-sale + rental construction is in the pipeline within 1–3 miles? Heavy new supply typically softens prices + rents 12–24 months out; constrained supply supports both.
CashFlowRE · CFR-2CG5V9D367YRC4
· Data 2 days ago
cashflowre.app · 2026-05-29