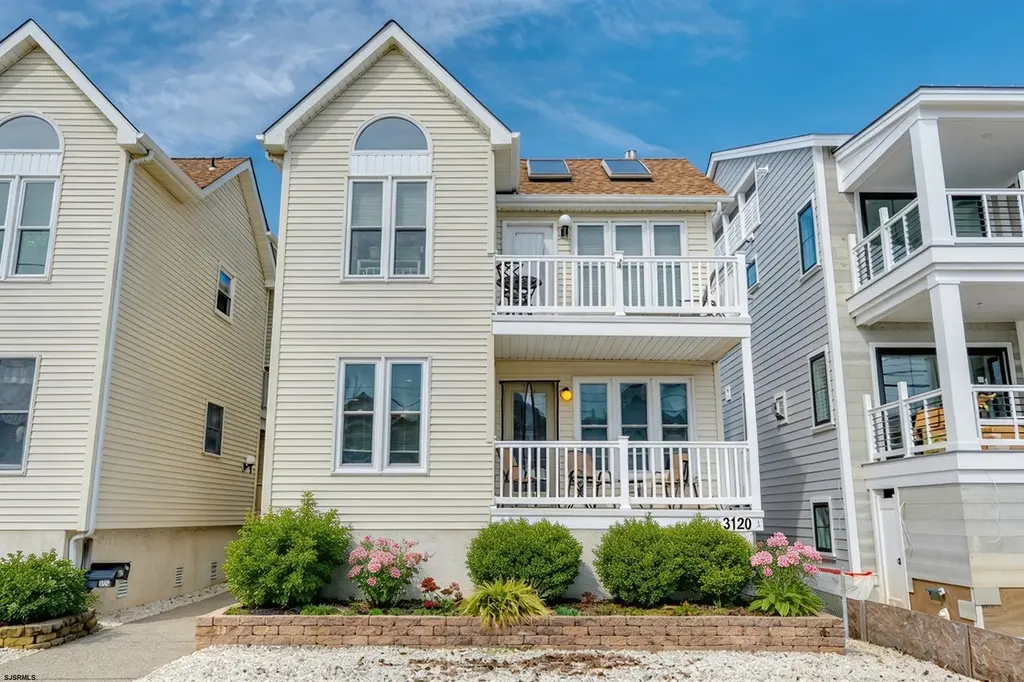
3120 West Ave #1st Fl.
Ocean City, NJ 08226
$850,000D
3 bd · 2.0 ba ·
1,176 sqft ·
Built 1988
· Condo
· Under Contract
· 70 DOM
Cashflow @ list (25.0% down · 7.5%)
Estimated rent
$7,266/mo
Mortgage (P&I)
−$4,457
Tax + insurance
−$1,417
HOA
−$0
Vac / Maint / Mgmt
−$1,526
Net cashflow
$-134/mo
Annual
$-1,608/yr
Cap rate
6.10%
Cash-on-cash
-0.68%
DSCR
0.97
1% rule
0.85%
Cash to close
$238,000
Investor read
- This is a 3-bed/2.0-bath condo listed at $850k. Condition is rated good.
- At list price, monthly cash flow is $-134 ($-2k/yr) — negative.
- To cash-flow at today's rent, offer at most $831k (2.3% below list).
- To meet the 1% rule (rent ≥ 1% of price), the offer needs to be $727k (14.5% below list).
- It's been on market 70 days — a 6% lower offer ($799k) is reasonable based on typical stale-listing flexibility.
- Recommended offer: $727k (14.5% below list) — sets the bar for 1% rule.
- Local home prices are declining (-3.0%/yr); year-one equity from $6k of loan paydown is wiped out by about $26k of value loss. Plan a longer hold.
- Location reads 80/100 on livability (#72 in NJ, #1,762 nationally) — a professional / high-income tenant draw. Strengths: amenities A+, employment A+, health & safety A+; Watch: housing D+, cost of living F.
- Ocean City School District (urban): math 31% / reading 53% proficiency, ranked #212 of 472 in NJ (top 45%) — families likely to look elsewhere, expect single-tenant / working-renter base with shorter leases.
- Zoned schools: Ocean City Primary School (math 54% / reading 42%, grade D, #299 of 1,303 statewide, top 23%, 280 students, 31% FRL); Ocean City Intermediate School (math 26% / reading 49%, grade F, #217 of 431 statewide, top 51%, 370 students, 27% FRL); Ocean City High School (math 33% / reading 63%, grade D, #117 of 399 statewide, top 30%, 1,215 students, 13% FRL) — zoned schools at 24% FRL track the district average.
- Market conditions: 427 active listings in the ZIP; 1 comparable units currently listed for rent nearby; 877 units permitted in Cape May County in 2024 (35 in 5+ unit buildings).
- Cape May County population projected at -24% by 2050 — secular population decline; favor cash flow + early exit over multi-decade hold.
- Cap rate 6.1% vs local median 3.3% in Ocean City — top-decile yield for the area; either an underpriced asset or a hidden risk that comps aren't pricing in. Stress-test before assuming the spread holds.
Questions for listing agent
- What do current leases actually rent for vs. the listed asking? Can we see a recent rent roll and the last 12 months of T-12 income?
- It's been on market 70 days. Have you received any prior offers? Is the seller open to a 15% concession, seller financing, or rate buy-down credit?
- Any open or pending special assessments — roof, HVAC, plumbing, elevator, façade? What's the per-unit balance and payoff schedule, and is the seller paying it off at close or rolling it to the buyer?
- Why hasn't it sold? Are there any deal-killer items the seller is aware of (foundation, flood, title, zoning, code violations)?
- Is there a deadline driving the sale (1031 exchange, divorce, estate, relocation)? That informs how much negotiation room exists.
- Schools are A-rated — typically a magnet for longer-tenancy family renters. What's the average tenant stay here, and is there a school-zone premium baked into asking?
- The area grade is low — what's the realistic commute time and amenity access for the typical tenant pool here? Any planned neighborhood developments (good or bad) we should know about?
- What's the average days-on-market for RENTAL listings here right now (not sales)? A rising rental-DOM trend means longer vacancies and softer asking-rent achievability than the comps imply.
CashFlowRE · CFR-2CY9H1FKBNQH4Y
· Data 3 weeks ago
cashflowre.app · 2026-05-29