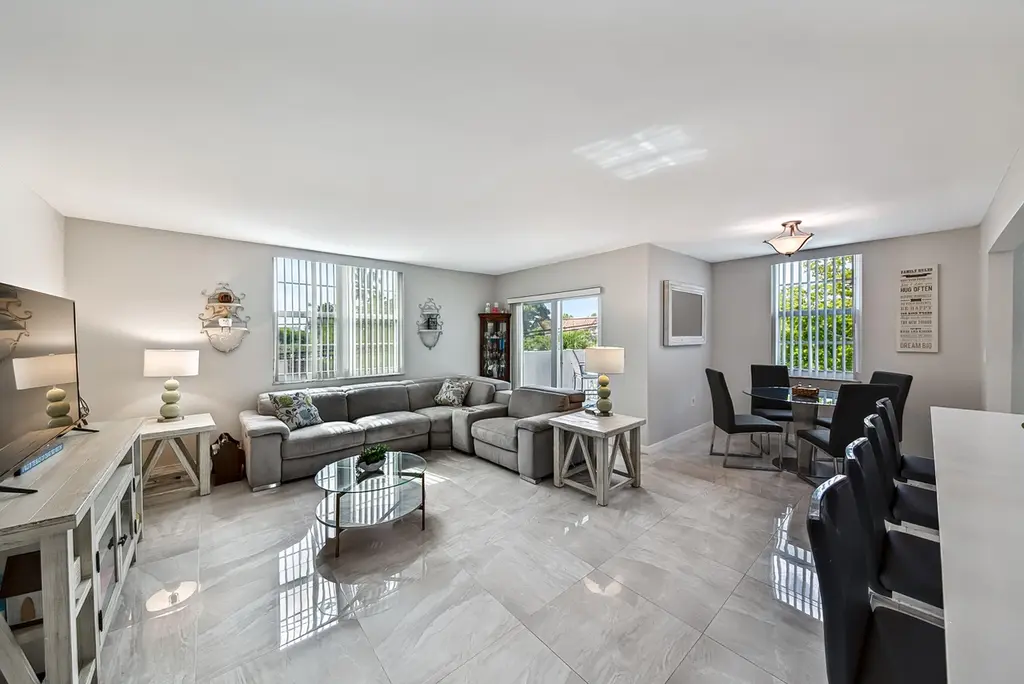
6000 NE 22nd Way Unit 3a
Fort Lauderdale, FL 33308
$319,000D
2 bd · 2.0 ba ·
1,158 sqft ·
Built 1976
· Condo
· Active
· 26 DOM
Cashflow @ list (25.0% down · 7.5%)
Estimated rent
$3,683/mo
Mortgage (P&I)
−$1,673
Tax + insurance
−$495
HOA
−$910
Vac / Maint / Mgmt
−$773
Net cashflow
$-169/mo
Annual
$-2,022/yr
Cap rate
5.66%
Cash-on-cash
-2.26%
DSCR
0.90
1% rule
1.15%
Cash to close
$89,320
Investor read
- This is a 2-bed/2.0-bath condo listed at $319k.
- At list price, monthly cash flow is $-169 ($-2k/yr) — negative.
- To cash-flow at today's rent, offer at most $289k (9.3% below list).
- Meets the 1% rule at list price ($4k rent vs $319k).
- It's been on market 26 days — a 2% lower offer ($314k) is reasonable based on typical stale-listing flexibility.
- Recommended offer: $289k (9.3% below list) — sets the bar for cash-flow.
- Local home prices are declining (-3.0%/yr); year-one equity from $2k of loan paydown is wiped out by about $10k of value loss. Plan a longer hold.
- Location reads 82/100 on livability (#78 in FL, #1,293 nationally) — a professional / high-income tenant draw. Strengths: crime A+, amenities A+, health & safety A+; Watch: cost of living D-.
- Broward (suburban): math 42% / reading 53% proficiency, ranked #46 of 73 in FL (top 63%) — families likely to look elsewhere, expect single-tenant / working-renter base with shorter leases.
- Zoned schools: Mcnab Elementary School (math 51% / reading 63%, grade C+, #781 of 2,144 statewide, top 38%, 614 students, 56% FRL); Pompano Beach Middle School (math 29% / reading 40%, grade F, #421 of 571 statewide, top 74%, 1,040 students, 73% FRL); Northeast High School (math 12% / reading 37%, grade F, #505 of 667 statewide, top 79%, 1,552 students, 69% FRL).
- Watch-outs: HOA is 25% of rent.
- Market conditions: Rents rising (+3.6%/yr); 746 active listings in the ZIP; 40 comparable units currently listed for rent nearby; rentals at typical pace (median 26d on market — plan ~3-4 weeks tenant-placement turnaround); solid renter incomes; 2,111 units permitted in Broward County in 2024 (1,265 in 5+ unit buildings).
- Broward County population projected at +34% by 2050 — long-run rental-demand tailwind backs the buy-and-hold thesis.
- 2 sale attempts with the ask held roughly flat each time — persistent listings suggest the price (not the market) is what's stuck; bring a comps-based counter.
- Cap rate 5.7% vs local median 2.2% in Fort Lauderdale — top-decile yield for the area; either an underpriced asset or a hidden risk that comps aren't pricing in. Stress-test before assuming the spread holds.
- At $3,683/mo this rent would consume 47% of the median local household income ($94k/yr) (locally 912% of renters already pay >50% of income on rent) — very limited rent-growth headroom before tenants either downsize or default.
Questions for listing agent
- What do current leases actually rent for vs. the listed asking? Can we see a recent rent roll and the last 12 months of T-12 income?
- Built in 1976 — when were the roof, HVAC, electrical panel, plumbing, and water heater last replaced?
- What does the HOA fee cover, when was the last increase, and are there any pending special assessments or reserve-fund shortfalls?
- Any open or pending special assessments — roof, HVAC, plumbing, elevator, façade? What's the per-unit balance and payoff schedule, and is the seller paying it off at close or rolling it to the buyer?
- Is there a deadline driving the sale (1031 exchange, divorce, estate, relocation)? That informs how much negotiation room exists.
- Schools are B-rated — typically a magnet for longer-tenancy family renters. What's the average tenant stay here, and is there a school-zone premium baked into asking?
- The area grade is low — what's the realistic commute time and amenity access for the typical tenant pool here? Any planned neighborhood developments (good or bad) we should know about?
- What's the average days-on-market for RENTAL listings here right now (not sales)? A rising rental-DOM trend means longer vacancies and softer asking-rent achievability than the comps imply.
CashFlowRE · CFR-2DH3GBDXEHXWZ9
· Data 1 day ago
cashflowre.app · 2026-05-29