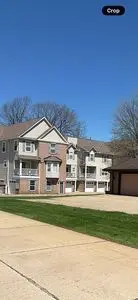
630 Tollis Pkwy
Broadview Heights, OH 44147
$212,000D-
2 bd · 3.0 ba ·
1,344 sqft ·
Built 2006
· Other
· Under Contract
· 1 DOM
Cashflow @ list (25.0% down · 7.5%)
Estimated rent
$1,670/mo
Mortgage (P&I)
−$1,112
Tax + insurance
−$353
HOA
−$0
Vac / Maint / Mgmt
−$351
Net cashflow
$-146/mo
Annual
$-1,753/yr
Cap rate
5.47%
Cash-on-cash
-2.95%
DSCR
0.87
1% rule
0.79%
Cash to close
$59,360
Investor read
- This is a 2-bed/3.0-bath other listed at $212k. Condition is rated fair.
- At list price, monthly cash flow is $-146 ($-2k/yr) — negative.
- To cash-flow at today's rent, offer at most $191k (10.0% below list).
- To meet the 1% rule (rent ≥ 1% of price), the offer needs to be $167k (21.2% below list).
- Only 1 days on market — expect competitive offers; lowballing is unlikely to land.
- Recommended offer: $167k (21.2% below list) — sets the bar for 1% rule.
- Local home prices are declining (-3.0%/yr); year-one equity from $1k of loan paydown is wiped out by about $6k of value loss. Plan a longer hold.
- Location reads 79/100 on livability (#150 in OH, #2,291 nationally) — a middle-class / working-renter tenant base. Strengths: schools A+, crime A+, employment A+; Watch: amenities F, commute F.
- Brecksville-Broadview Heights City (suburban): math 85% / reading 85% proficiency, ranked #23 of 656 in OH (top 4%) — strong family-tenant draw, lease renewals of 3-5y typical; only 10% free/reduced lunch — higher-income household profile.
- Market conditions: 102 active listings in the ZIP; 4 comparable units currently listed for rent nearby; rentals leasing fast (median 2d on market — plan ~1-2 weeks tenant-placement turnaround); solid renter incomes; 1,441 units permitted in Cuyahoga County in 2024 (700 in 5+ unit buildings).
- Cuyahoga County population projected to shrink 8% by 2050 — rents likely to lag national; underwrite the cash flow, not the appreciation.
- Cap rate 5.5% vs local median 2.6% in Broadview Heights — top-decile yield for the area; either an underpriced asset or a hidden risk that comps aren't pricing in. Stress-test before assuming the spread holds.
Questions for listing agent
- What do current leases actually rent for vs. the listed asking? Can we see a recent rent roll and the last 12 months of T-12 income?
- Have any recent inspections been done? Can we get a copy of the seller's disclosures and any deferred-maintenance estimates?
- Is there a deadline driving the sale (1031 exchange, divorce, estate, relocation)? That informs how much negotiation room exists.
- Schools are A-rated — typically a magnet for longer-tenancy family renters. What's the average tenant stay here, and is there a school-zone premium baked into asking?
- The area grade is low — what's the realistic commute time and amenity access for the typical tenant pool here? Any planned neighborhood developments (good or bad) we should know about?
- What's the average days-on-market for RENTAL listings here right now (not sales)? A rising rental-DOM trend means longer vacancies and softer asking-rent achievability than the comps imply.
- What's the recent tenant-quality profile in this submarket — average credit score on applications, eviction rate, late-payment / NSF rate, and stable-employment percentage? A property-management company in the area should have these aggregated.
- How much new for-sale + rental construction is in the pipeline within 1–3 miles? Heavy new supply typically softens prices + rents 12–24 months out; constrained supply supports both.
Repairs flagged (vision-AI assessment)
- Minor: roof — No visible damage, but may need inspection
- Minor: exterior siding — No visible damage, but may need cleaning
- Minor: interior walls — No visible damage, but may need touch-up
CashFlowRE · CFR-2DK7A14540JASY
· Data 3 weeks ago
cashflowre.app · 2026-05-29