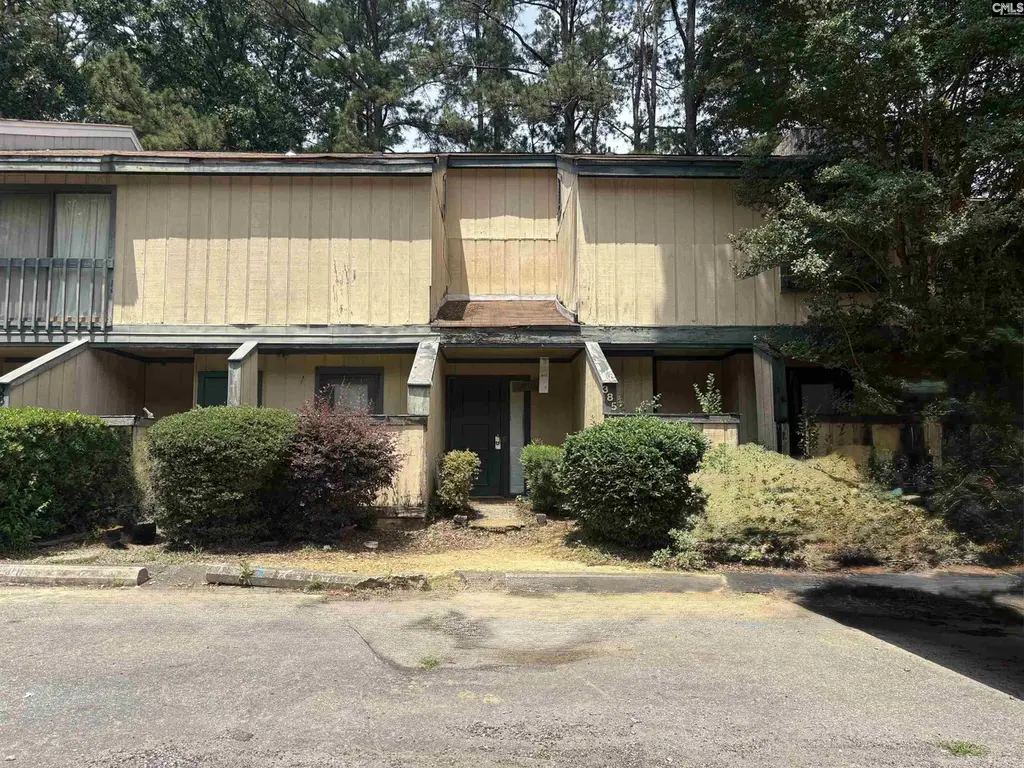
385 Hickory Hill Dr
St. Andrews, SC 29210-4647
$99,000C+
3 bd · 2.0 ba ·
1,151 sqft ·
Built 1974
· Townhouse
· Active
· 8 DOM
Cashflow @ list (25.0% down · 7.5%)
Estimated rent
$1,313/mo
Mortgage (P&I)
−$519
Tax + insurance
−$131
HOA
−$200
Vac / Maint / Mgmt
−$276
Net cashflow
$187/mo
Annual
$2,244/yr
Cap rate
8.56%
Cash-on-cash
8.10%
DSCR
1.36
1% rule
1.33%
Cash to close
$27,720
Investor read
- This is a 3-bed/2.0-bath townhouse listed at $99k.
- At list price, monthly cash flow is $187 ($2k/yr) — positive.
- The deal already cash-flows at list — no discount required.
- Meets the 1% rule at list price ($1k rent vs $99k).
- Only 8 days on market — expect competitive offers; lowballing is unlikely to land.
- In year one you build about $4k of equity ($684 loan paydown + $3k appreciation (3.0% local appreciation)).
- Location reads: area grade C — affects rentability + tenant quality, not the cash-flow math above.
- Richland 01 (urban): math 26% / reading 36% proficiency, ranked #54 of 80 in SC (top 68%) — families likely to look elsewhere, expect single-tenant / working-renter base with shorter leases; 64% free/reduced lunch — lower-income household profile, screen leases tightly.
- Zoned schools: Pine Grove Elementary (math 24% / reading 15%, grade F, #496 of 597 statewide, top 83%, 541 students, 100% FRL); St. Andrews Middle (math 9% / reading 18%, grade F, #207 of 229 statewide, top 91%, 706 students, 100% FRL); Columbia High (math 17% / reading 67%, grade F, #174 of 196 statewide, top 90%, 665 students, 100% FRL) — zoned schools average 100% FRL vs 64% district-wide (36 pts higher); higher-poverty schools than district average — tighter screening recommended.
- Market conditions: 1 active listings in the ZIP; 40 comparable units currently listed for rent nearby; rentals at typical pace (median 24d on market — plan ~3-4 weeks tenant-placement turnaround); 3,472 units permitted in Richland County in 2024 (1,096 in 5+ unit buildings).
- Richland County population projected at +30% by 2050 — long-run rental-demand tailwind backs the buy-and-hold thesis.
- 3 sale attempts with the ask held roughly flat each time — persistent listings suggest the price (not the market) is what's stuck; bring a comps-based counter.
- Current owner paid $73k; 36% above their basis — modest negotiation headroom, anchor on the comps not their cost.
- At projected returns (3.0% appreciation + 3.0% rent growth), your $28k cash investment doubles in ~5 years — after that, you're playing with house money.
- By year 9, paydown + projected appreciation supports a ~$31k cash-out refi (75% LTV) — recoverable capital for the next deal without selling this one.
- Climate carrying-cost: major wind risk, 64% chance of damaging wind over 30y; extreme-heat days projected 7→16/yr by 2055 (HVAC capex compounding) — expect insurance premiums to compound above CPI over the hold.
Questions for listing agent
- Built in 1974 — when were the roof, HVAC, electrical panel, plumbing, and water heater last replaced?
- What does the HOA fee cover, when was the last increase, and are there any pending special assessments or reserve-fund shortfalls?
- Is there a deadline driving the sale (1031 exchange, divorce, estate, relocation)? That informs how much negotiation room exists.
- What's the average days-on-market for RENTAL listings here right now (not sales)? A rising rental-DOM trend means longer vacancies and softer asking-rent achievability than the comps imply.
- What's the recent tenant-quality profile in this submarket — average credit score on applications, eviction rate, late-payment / NSF rate, and stable-employment percentage? A property-management company in the area should have these aggregated.
- How much new for-sale + rental construction is in the pipeline within 1–3 miles? Heavy new supply typically softens prices + rents 12–24 months out; constrained supply supports both.
CashFlowRE · CFR-2E4WGBBF2W4XXZ
· Data 1 day ago
cashflowre.app · 2026-05-29