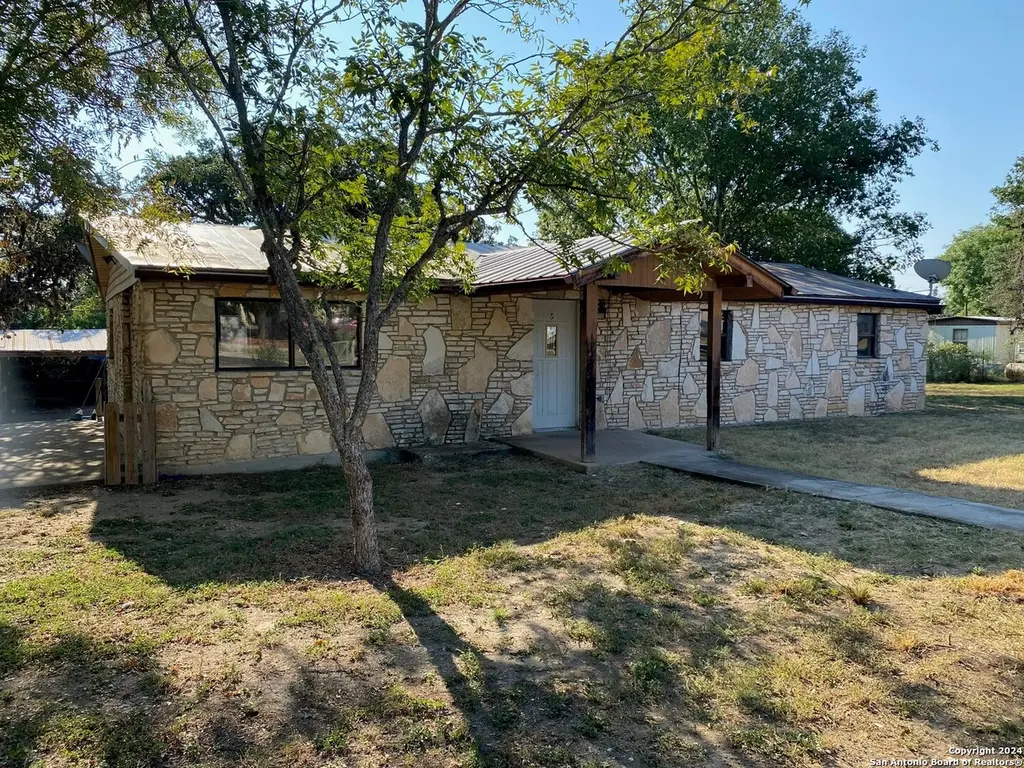
186 Oak Rdg
Center Point, TX 78010
$329,000C-
3 bd · 2.0 ba ·
1,152 sqft ·
Built 1988
· SingleFamily
· Active
· 634 DOM
Cashflow @ list (25.0% down · 7.5%)
Estimated rent
$2,836/mo
Mortgage (P&I)
−$1,725
Tax + insurance
−$197
HOA
−$0
Vac / Maint / Mgmt
−$595
Net cashflow
$318/mo
Annual
$3,819/yr
Cap rate
7.45%
Cash-on-cash
4.15%
DSCR
1.18
1% rule
0.86%
Cash to close
$92,120
Investor read
- This is a 3-bed/2.0-bath single-family listed at $329k.
- At list price, monthly cash flow is $318 ($4k/yr) — positive.
- The deal already cash-flows at list — no discount required.
- To meet the 1% rule (rent ≥ 1% of price), the offer needs to be $284k (13.8% below list).
- It's been on market 634 days — a 12% lower offer ($290k) is reasonable based on typical stale-listing flexibility.
- Recommended offer: $284k (13.8% below list) — sets the bar for 1% rule.
- In year one you build about $6k of equity ($2k loan paydown + $4k appreciation (1.1% local appreciation)).
- Location reads: area grade C — affects rentability + tenant quality, not the cash-flow math above.
- Center Point ISD (rural): math 36% / reading 47% proficiency, ranked #359 of 826 in TX (top 44%) — families likely to look elsewhere, expect single-tenant / working-renter base with shorter leases; 65% free/reduced lunch — lower-income household profile, screen leases tightly.
- Zoned schools: Center Point El (math 42% / reading 37%, grade F, #1,545 of 4,322 statewide, top 38%, 265 students, 75% FRL); Center Point Middle (math 32% / reading 47%, grade F, #660 of 1,662 statewide, top 41%, 109 students, 74% FRL); Center Point H S (math 24% / reading 64%, grade F, #652 of 1,632 statewide, top 43%, 175 students, 65% FRL).
- Market conditions: 73 active listings in the ZIP; 422 units permitted in Kerr County in 2024 (322 in 5+ unit buildings).
- Kerr County population projected at +15% by 2050 — long-run rental-demand tailwind backs the buy-and-hold thesis.
- 3 sale attempts since 2y ago; this cycle's ask has dropped $20k (6%) from the opening price — seller is motivated, your offer sets the floor, not the list.
- At projected returns (1.1% appreciation + 3.0% rent growth), your $92k cash investment doubles in ~8 years — after that, you're playing with house money.
- By year 6, paydown + projected appreciation supports a ~$34k cash-out refi (75% LTV) — recoverable capital for the next deal without selling this one.
- Climate carrying-cost: major wind risk, 50% chance of damaging wind over 30y; moderate wildfire risk; extreme-heat days projected 7→23/yr by 2055 (HVAC capex compounding) — expect insurance premiums to compound above CPI over the hold.
- Cap rate 7.5% vs local median 2.0% in Center Point — top-decile yield for the area; either an underpriced asset or a hidden risk that comps aren't pricing in. Stress-test before assuming the spread holds.
Questions for listing agent
- It's been on market 634 days. Have you received any prior offers? Is the seller open to a 14% concession, seller financing, or rate buy-down credit?
- Why hasn't it sold? Are there any deal-killer items the seller is aware of (foundation, flood, title, zoning, code violations)?
- Is there a deadline driving the sale (1031 exchange, divorce, estate, relocation)? That informs how much negotiation room exists.
- What's the average days-on-market for RENTAL listings here right now (not sales)? A rising rental-DOM trend means longer vacancies and softer asking-rent achievability than the comps imply.
- What's the recent tenant-quality profile in this submarket — average credit score on applications, eviction rate, late-payment / NSF rate, and stable-employment percentage? A property-management company in the area should have these aggregated.
- How much new for-sale + rental construction is in the pipeline within 1–3 miles? Heavy new supply typically softens prices + rents 12–24 months out; constrained supply supports both.
CashFlowRE · CFR-2GKQA54YBDG3EQ
· Data 1 week ago
cashflowre.app · 2026-05-29