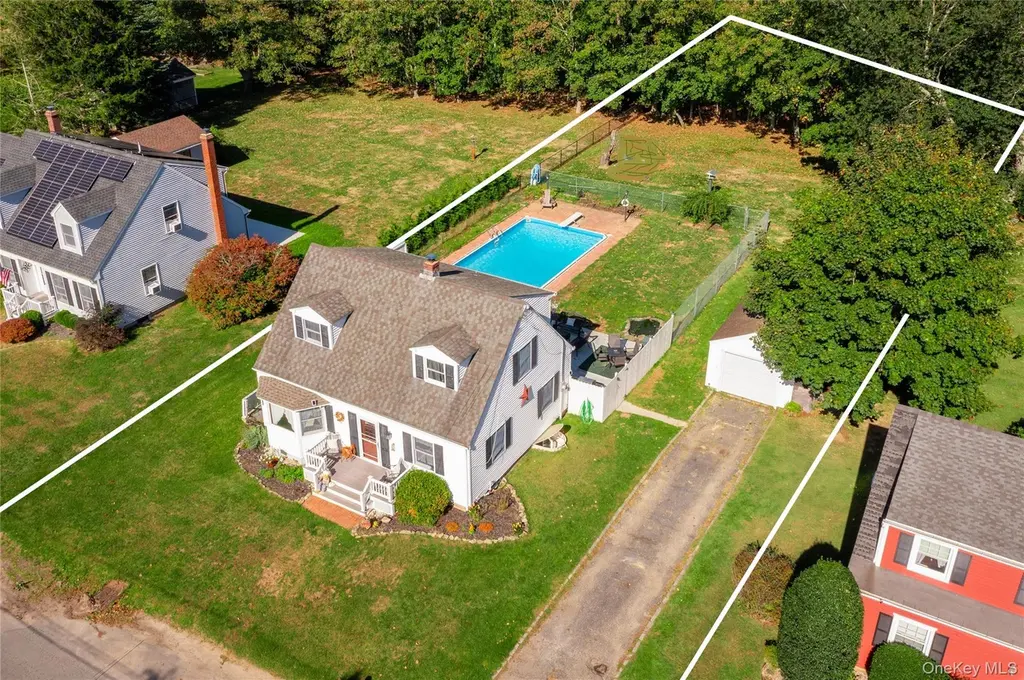
28 (aka 710) Sound Rd
Greenport West, NY 11944
$899,000B+
3 bd · 3.0 ba ·
2,200 sqft ·
Built 1958
· SingleFamily
· Active
· 34 DOM
Cashflow @ list (25.0% down · 7.5%)
Estimated rent
$19,008/mo
Mortgage (P&I)
−$4,714
Tax + insurance
−$1,498
HOA
−$0
Vac / Maint / Mgmt
−$3,992
Net cashflow
$8,804/mo
Annual
$105,645/yr
Cap rate
18.04%
Cash-on-cash
41.97%
DSCR
2.87
1% rule
2.11%
Cash to close
$251,720
Investor read
- This is a 3-bed/3.0-bath single-family listed at $899k. Condition is rated average.
- At list price, monthly cash flow is $9k ($106k/yr) — positive.
- The deal already cash-flows at list — no discount required.
- Meets the 1% rule at list price ($19k rent vs $899k).
- It's been on market 34 days — a 3% lower offer ($872k) is reasonable based on typical stale-listing flexibility.
- Recommended offer: $872k (3.0% below list) — sets the bar for market timing.
- Local home prices are declining (-3.0%/yr); year-one equity from $6k of loan paydown is wiped out by about $27k of value loss. Plan a longer hold.
- Location reads 58/100 on livability (#1,073 in NY) — a working-class tenant base; expect higher turnover. Strengths: crime A+, employment A+; Watch: amenities F, commute F, cost of living F.
- Greenport Union Free School District (town): math 55% / reading 45% proficiency, ranked #450 of 755 in NY (top 60%) — acceptable for families but not a draw, mixed tenant base, ~2y average lease.
- Zoned schools: Greenport Elementary School (math 47% / reading 62%, grade C, #908 of 2,108 statewide, top 46%, 339 students, 61% FRL); Greenport High School (math 52% / reading 54%, grade C-, #934 of 1,100 statewide, top 86%, 356 students, 63% FRL).
- Watch-outs: built in 1958 — expect roof / HVAC / electrical / plumbing capex.
- Market conditions: 67 active listings in the ZIP; 6 comparable units currently listed for rent nearby; rentals lingering (median 44d on market — plan ~5-8 weeks vacancy on turnover, expect pricing pressure); 67% of comp listings sitting > 30 days — soft ceiling on asking rent; 1,366 units permitted in Suffolk County in 2024 (216 in 5+ unit buildings).
- Suffolk County population projected to shrink 5% by 2050 — rents likely to lag national; underwrite the cash flow, not the appreciation.
- At projected returns (-3.0% appreciation + 3.0% rent growth), your $252k cash investment doubles in ~3 years — after that, you're playing with house money.
- Cap rate 18.0% vs local median 8.0% in Greenport West — top-decile yield for the area; either an underpriced asset or a hidden risk that comps aren't pricing in. Stress-test before assuming the spread holds.
Questions for listing agent
- It's been on market 34 days. Have you received any prior offers? Is the seller open to a 3% concession, seller financing, or rate buy-down credit?
- Built in 1958 — when were the roof, HVAC, electrical panel, plumbing, and water heater last replaced?
- Is there a deadline driving the sale (1031 exchange, divorce, estate, relocation)? That informs how much negotiation room exists.
- Schools are D-rated, which usually means shorter tenancies and higher turnover. Who's the typical renter profile here, and what's been the actual vacancy rate?
- What's the average days-on-market for RENTAL listings here right now (not sales)? A rising rental-DOM trend means longer vacancies and softer asking-rent achievability than the comps imply.
- What's the recent tenant-quality profile in this submarket — average credit score on applications, eviction rate, late-payment / NSF rate, and stable-employment percentage? A property-management company in the area should have these aggregated.
- How much new for-sale + rental construction is in the pipeline within 1–3 miles? Heavy new supply typically softens prices + rents 12–24 months out; constrained supply supports both.
Repairs flagged (vision-AI assessment)
- Minor: kitchen cabinets — existing cabinets need updating
- Minor: bathroom fixtures — existing fixtures need updating
- Minor: roof shingles — existing shingles need inspection
- Minor: exterior siding — existing siding needs repainting
- Minor: flooring — existing hardwood and carpet need updating
- Minor: interior walls/paint — existing paint needs touch-up
CashFlowRE · CFR-2PH2ZGAQGMF3XR
· Data 2 days ago
cashflowre.app · 2026-05-29