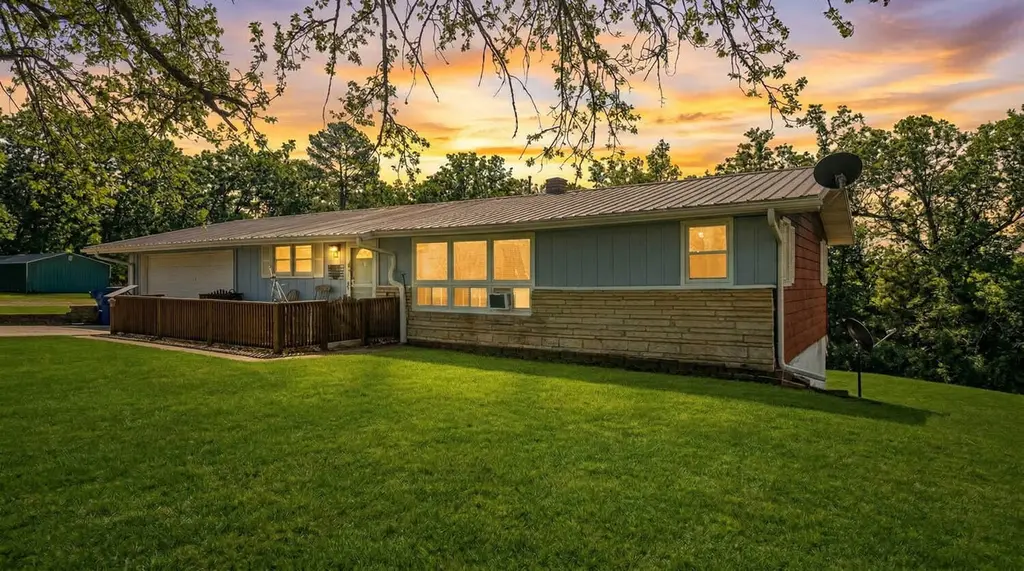
2250 Main St
Mammoth Spring, AR 72554
$169,900D
3 bd · 2.0 ba ·
1,412 sqft ·
Built 1975
· SingleFamily
· Active
· 77 DOM
Cashflow @ list (25.0% down · 7.5%)
Estimated rent
$1,147/mo
Mortgage (P&I)
−$891
Tax + insurance
−$145
HOA
−$0
Vac / Maint / Mgmt
−$241
Net cashflow
$-130/mo
Annual
$-1,557/yr
Cap rate
5.38%
Cash-on-cash
-3.27%
DSCR
0.85
1% rule
0.68%
Cash to close
$47,572
Investor read
- This is a 3-bed/2.0-bath single-family listed at $170k.
- At list price, monthly cash flow is $-130 ($-2k/yr) — negative.
- To cash-flow at today's rent, offer at most $147k (13.5% below list).
- To meet the 1% rule (rent ≥ 1% of price), the offer needs to be $115k (32.5% below list).
- It's been on market 77 days — a 6% lower offer ($160k) is reasonable based on typical stale-listing flexibility.
- Recommended offer: $115k (32.5% below list) — sets the bar for 1% rule.
- In year one you build about $13k of equity ($1k loan paydown + $12k appreciation (7.0% local appreciation)).
- Location reads 77/100 on livability (#7 in AR, #2,817 nationally) — a middle-class / working-renter tenant base. Strengths: crime A+, cost of living A+, housing A+; Watch: employment C-, amenities F, commute F.
- Mammoth Spring School District (town): math 31% / reading 39% proficiency, ranked #126 of 238 in AR (top 53%) — families likely to look elsewhere, expect single-tenant / working-renter base with shorter leases.
- Zoned schools: Mammoth Spring Elem. School (math 42% / reading 37%, grade F, #206 of 454 statewide, top 48%, 285 students, 100% FRL); Mammoth Spring High School (math 22% / reading 37%, grade F, #142 of 292 statewide, top 53%, 223 students, 100% FRL) — zoned schools average 100% FRL vs 55% district-wide (45 pts higher); higher-poverty schools than district average — tighter screening recommended.
- Market conditions: 88 active listings in the ZIP.
- Fulton County population projected at -17% by 2050 — secular population decline; favor cash flow + early exit over multi-decade hold.
- 3 sale attempts since 5y ago with the ask held roughly flat each time — persistent listings suggest the price (not the market) is what's stuck; bring a comps-based counter.
- By year 3, paydown + projected appreciation supports a ~$32k cash-out refi (75% LTV) — recoverable capital for the next deal without selling this one.
- Cap rate 5.4% vs local median 2.9% in Mammoth Spring — top-decile yield for the area; either an underpriced asset or a hidden risk that comps aren't pricing in. Stress-test before assuming the spread holds.
Questions for listing agent
- What do current leases actually rent for vs. the listed asking? Can we see a recent rent roll and the last 12 months of T-12 income?
- It's been on market 77 days. Have you received any prior offers? Is the seller open to a 32% concession, seller financing, or rate buy-down credit?
- Built in 1975 — when were the roof, HVAC, electrical panel, plumbing, and water heater last replaced?
- Why hasn't it sold? Are there any deal-killer items the seller is aware of (foundation, flood, title, zoning, code violations)?
- Is there a deadline driving the sale (1031 exchange, divorce, estate, relocation)? That informs how much negotiation room exists.
- The area grade is low — what's the realistic commute time and amenity access for the typical tenant pool here? Any planned neighborhood developments (good or bad) we should know about?
- What's the average days-on-market for RENTAL listings here right now (not sales)? A rising rental-DOM trend means longer vacancies and softer asking-rent achievability than the comps imply.
- What's the recent tenant-quality profile in this submarket — average credit score on applications, eviction rate, late-payment / NSF rate, and stable-employment percentage? A property-management company in the area should have these aggregated.
CashFlowRE · CFR-2Q7ZP80Y28Y5W2
· Data 23 h ago
cashflowre.app · 2026-05-29